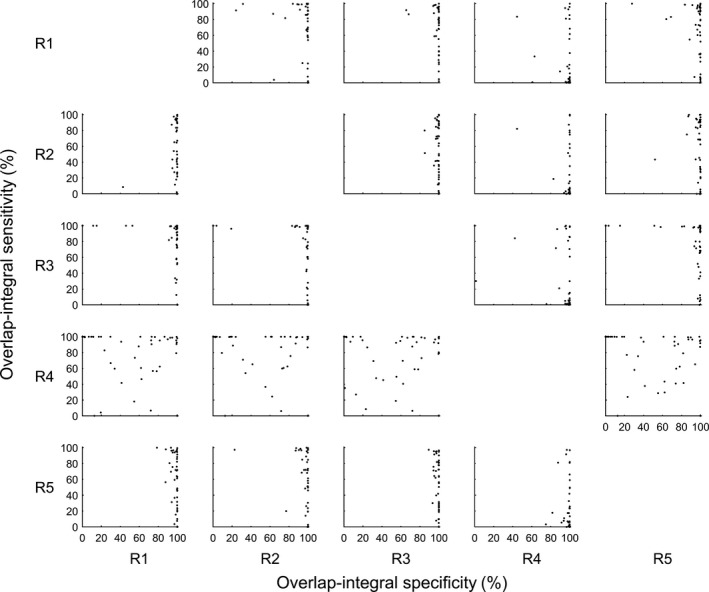
Figure 1.

OI‐Sn versus OI‐Sp scattergrams between each reader pair. Data shown are 5 × 4 × 50 matrices used in the statistical analysis for this study. Each data point represents OI‐Sn (y coordinate) and OI‐Sp (x coordinate) of each patient (n = 50). Each row represents OI‐Sn and OI‐Sp value pairs of a test reader (R1–R5 in row labels) against each reference reader (R1–R5 in column labels).
