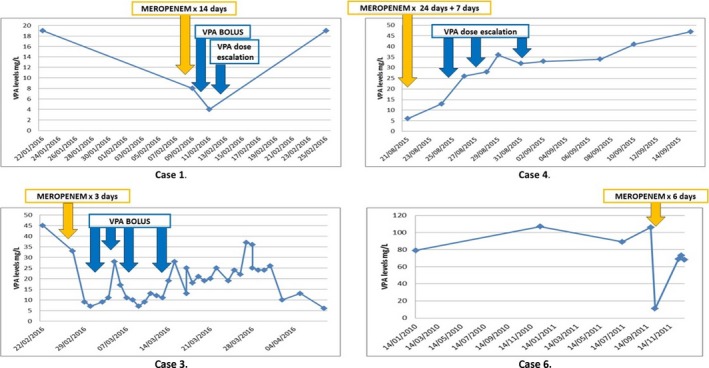
Figure 1.

Graphical representation of serum sodium valproate (VPA) levels before and after meropenem therapy. Duration of meropenem therapy and VPA dose adjustments are indicated at the relevant time points. Yellow arrows indicate the starting date of meropenem therapy; a dose of 1 g eight hourly was given in each case.
