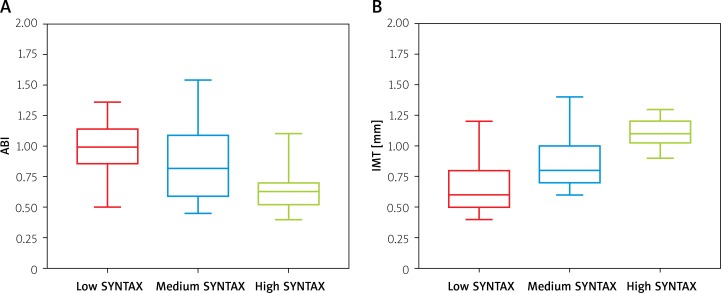
Figure 2.
Ankle-brachial index (ABI) (A) and intima-media thickness (IMT) (B) for low (0–4 points), medium (5–11 points) and high SYNTAX score (12 points and more). Means for low SYNTAX score were 1 ±0.2 for ABI and 0.7 ±0.3 mm for IMT; for medium SYNTAX score were 0.9 ±0.3 for ABI and 0.9 ±0.2 mm for IMT; for high SYNTAX score were 0.7 ±0.2 for ABI and 1.1 ±0.1 mm for IMT. Markings on the graphs outside box plots represent outliers. Box shows range from first to third quartile. Whiskers show maximal and minimal non-outlier values. The vertical line in the box plot shows the median. All results were significant with p < 0.001 for IMT and p = 0.006 for ABI

