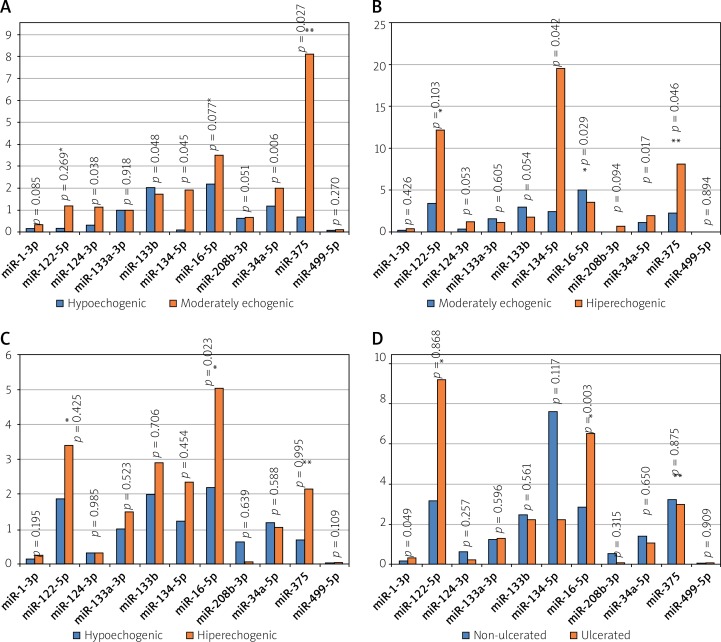
Figure 2.
Comparison of miR expression in patients with respect to plaque echogenicity. A – Plaque hypoechogenic vs. moderately echogenic, B – plaque moderately echogenic vs. hyperechogenic, C – plaque hypoechogenic vs. hyperechogenic, D – ulcerated vs. non-ulcerated plaque
*Indicates values with × 10–2, **values × 10–1.

