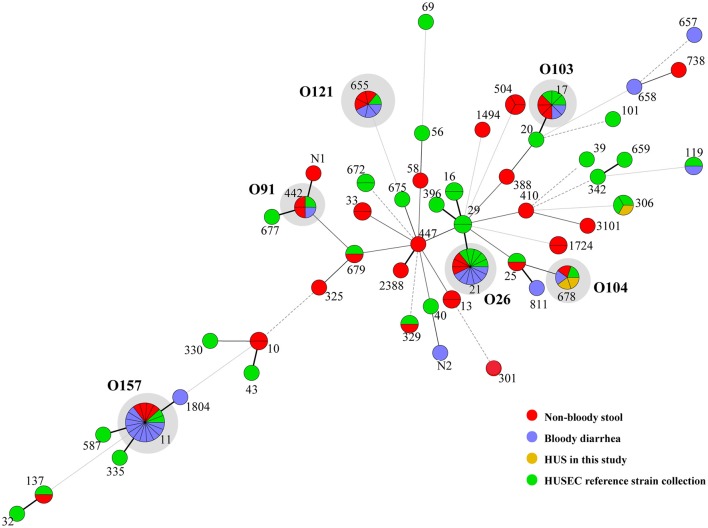
Figure 1.
Minimum spanning tree of 33 STs in this study and 31 STs from HUSEC collection. Each circle represents an ST with the size being proportional to the number of isolates. The colors for the slices of the pie represent the sources of isolates (see labeling in the lower right corner). The predominant STs comprising of strains in this study and HUSEC reference collection are indicated in gray shadows, with serogroups demonstrated aside.

