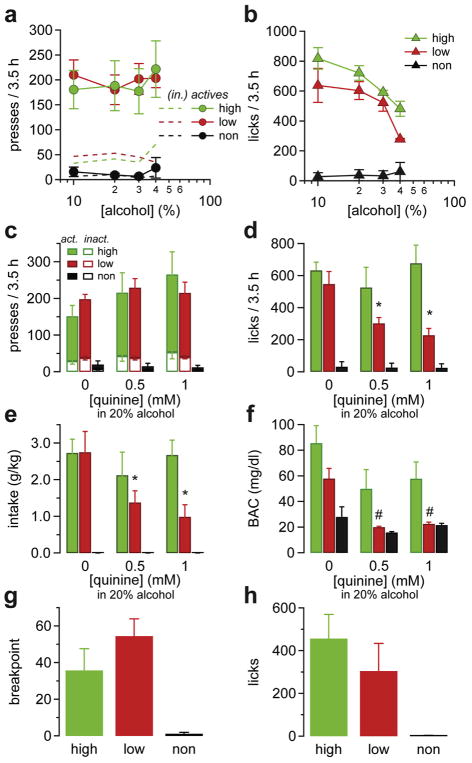
Fig. 6. High- and low-drinking mice have different sensitivity to alcohol dose and quinine adulteration.
(a, b) Dose-response curve showing (a) rate of active presses and (b) rate of licks as a function of the alcohol concentrations in the delivered solution for each group. (c–f) Effect of quinine adulteration on (c) the rate of lever presses, (d) the rate of licks, (e) the mean intake per session, and (f) the BAC after the session for each group of mice. Note that alcohol seeking (licks) and intake, but not active presses, are decreased in low-drinking mice when alcohol is mixed with 0.5–1 mM quinine but remain constant in high-alcohol drinking mice. (g) Breakpoints and (h) licks performed by mice in the low-, high-, and non-drinking groups during a progressive responding session. All data are mean ± SEM. *p < 0.05 in 2WRM-ANOVA in dose comparison within groups, #p < 0.05 in 2WRM-ANOVA comparison between Low vs. Higher drinking mice.

