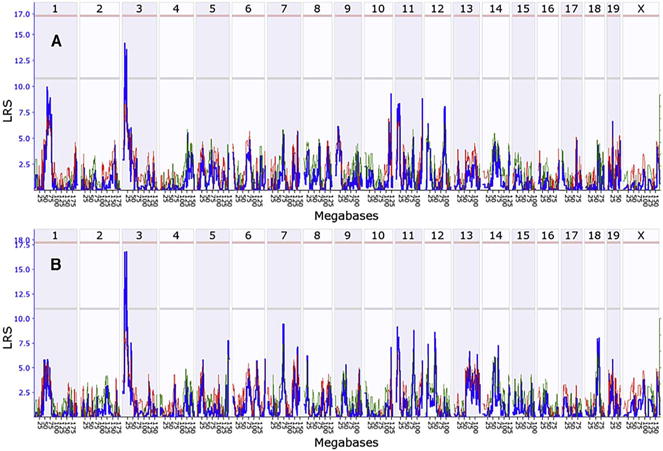
Fig. 3.

Interval map of axon number across the mouse genome is illustrated for the normal eye (A) and the eye 21 days following elevation of IOP (B). The blue line indicates the total likelihood ratio statistic (LRS) score as specified on the Y-axis. The red line illustrates the contribution from the B6 allele and the green line the contribution from the D2 allele. The location across the genome is indicated on the top from chromosome 1 to chromosome X. Notice one suggestive QTL peak on Chr3 (exceeding the gray line, p < 0.63).
