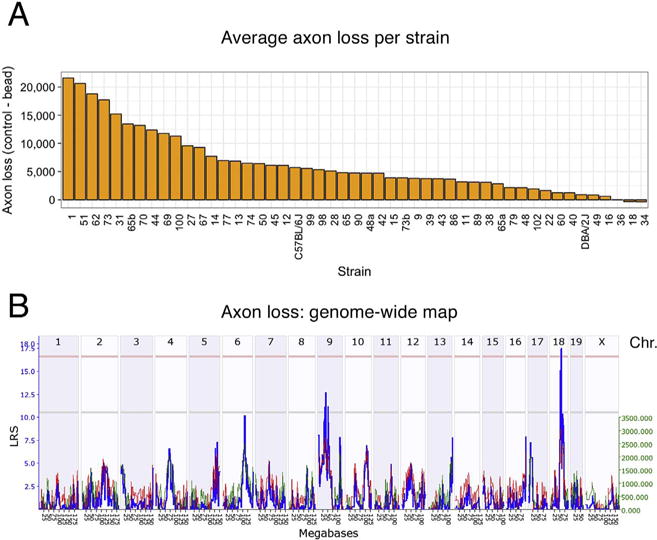
Fig. 4.

The average axon loss per strain is given in (A) in decreasing order. The genome-wide interval map is shown in (B). Here, chromosomes are displayed on the X axis, while the LRS score is plotted in blue along the Y-axis. The light red line defines the genome-wide QTL significance interval of p < 0.05, while the light grey line identifies a suggestive QTL. Notice one significant LRS peak on chromosome 18 and one suggestive QTL on chromosome 9.
