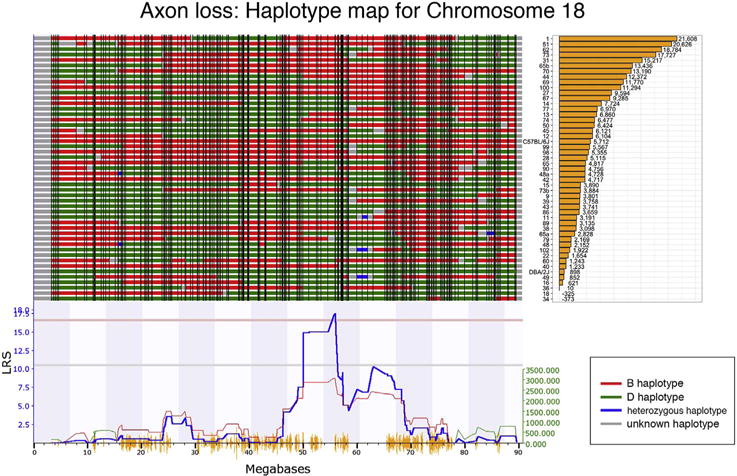
Fig. 5.

Map of gene locations across Chr. 18. The haplotype map for the 47 strains in the axon loss da-taset is shown in the top panel. The haplotype map displays the contribution of each of the two parental strains. The red represents the B6 alleles, green defines the D2 alleles, blue represents regions of the DNA that are heterozygotic and gray is unmapped. At the far right is a list of the specific BXD RI strains with the associated axon loss in decreasing order from top to bottom. The QTL significance is indicated by the blue-line below the haplotype map. A positive additive coefficient (red line) indicates that B6 alleles are associated with higher trait values. The QTL reaches significance from ~56 to ~58 Mb (p < 0.05, light red line).
