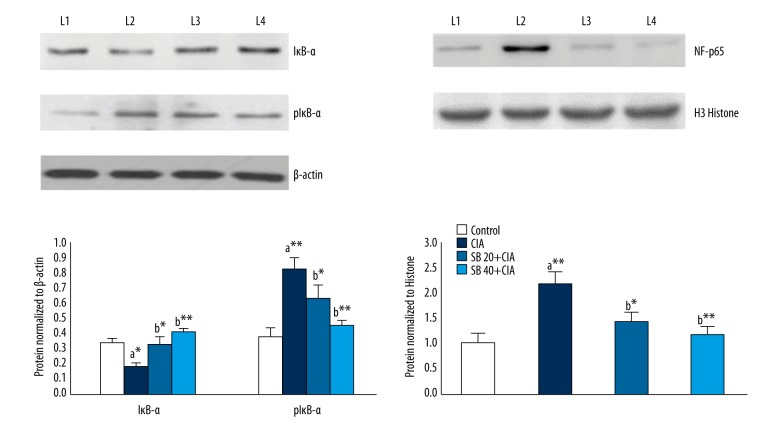
Figure 7.
Effects of SB on IκB-α, p IκB-α, and NF-κB p65 protein levels in the joint tissues of control and experimental rats. Data are means ±SD of 12 rats per group. ** p<0.01, * p<0.05. a CIA vs. control group, b SB treatment (20 and 40 mg/kg) vs. CIA group. β-actin and histone H3 were used as internal standards. Lane 1, control; lane 2, CIA group; lane 3, SB 20 mg/kg group, lane 4, SB 40 mg/kg group.

