. 2018 Mar 26;9(15):3788–3792. doi: 10.1039/c8sc00994e

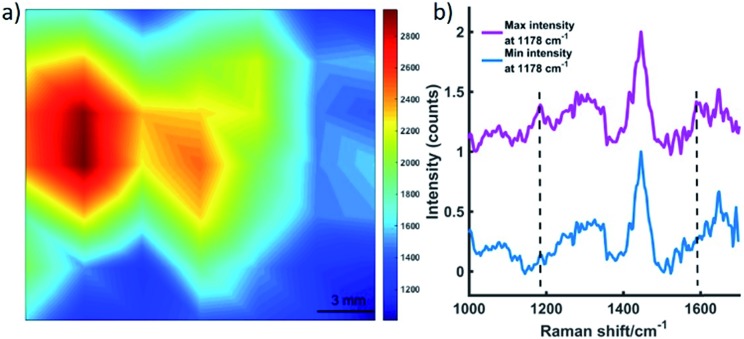
Fig. 2. (a) A false colour xy-2D heat SESORRS map of MTS containing dye 823 through 15 mm of tissue. The map was constructed using the peak intensity at 1178 cm–1. Measurements were carried out using an xy translational stage in step sizes of 3 mm to create an image of 7 × 7 pixels. Spectra were truncated, baselined and smoothed prior to processing. A combination surface/contour false colour was used to generate a 2D heat map and show the tracking of the MTS through 15 mm of tissue. Clear discrimination is seen between spectra collected at the point of maximum intensity where the nanotags uptaken into MTS models were spotted, and that collected where the MTS were not present. (b) The corresponding maximum and minimum collected 8 mm offset spectra. All measurements were carried out using a 2 s integration time, 5 accumulations, 830 nm laser excitation wavelength.

Fig. 2