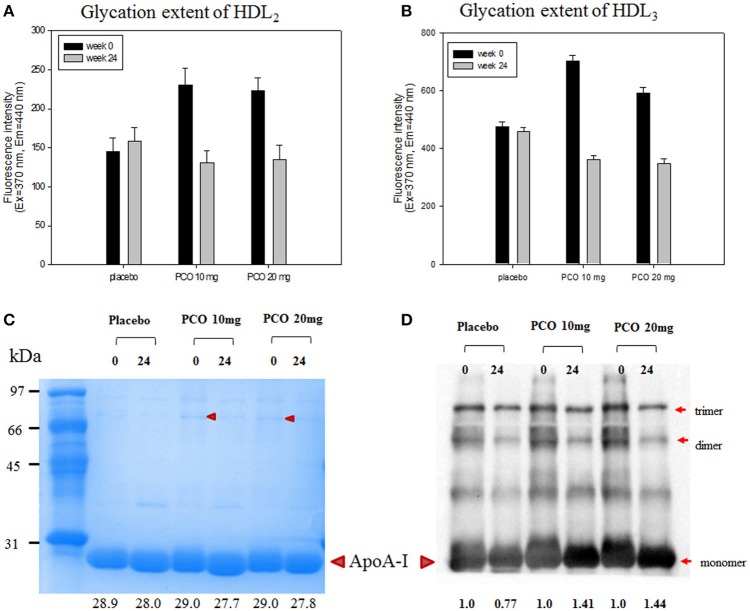
Figure 3.
Glycation extent and expression level of apoA-I in HDL2 and HDL3 at weeks 0 and 24. (A) Fluorometric determination (Ex = 370 nm, Em = 440 nm) of glycation extent at weeks 0 and 24 of HDL2. (B) Fluorometric determination (Ex = 370 nm, Em = 440 nm) of glycation extent at weeks 0 and 24 of HDL3. (C) Electrophoretic patterns of HDL3 from each group at weeks 0 and 24 (5 μg/lane, 15% SDS-PAGE). Lower numbers indicate calculated molecular weight of apoA-I using Chemi-Doc (Bio-Rad). (D) Immunodetection of apoA-I in HDL3 using anti-human apoA-I antibody (ab7613, Abcam). Lower numbers indicate calculated band intensity of apoA-I using Chemi-Doc (Bio-Rad).

