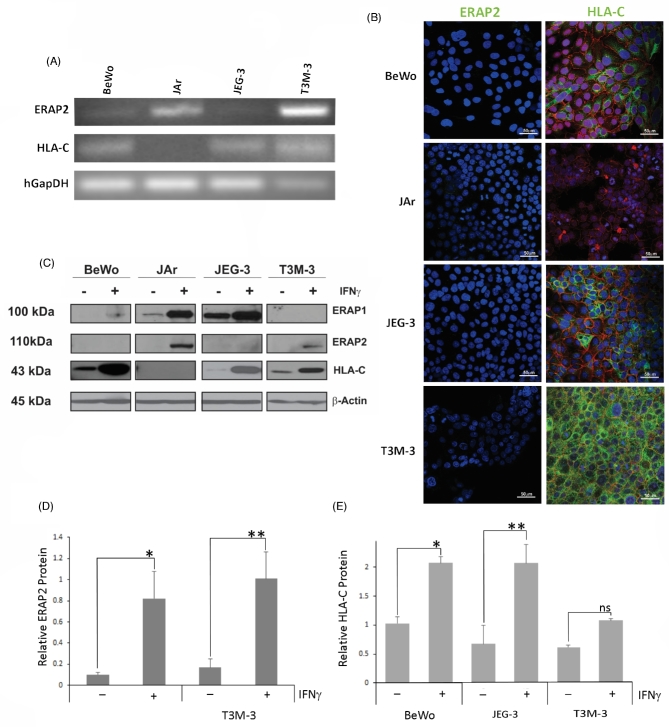
Figure 2.
ERAP2 and HLA-C profiles in choriocarcinoma cell lines. (A) Reverse transcriptase analysis of choriocarcinoma cell lines. RNA was extracted from BeWo, JAr, JEG-3, and T3M-3 cells and converted to cDNA. ERAP2 mRNA was detected in JAr and T3M-3 cells only, whereas HLA-C mRNA expression was detected in all cell lines tested, except JAr. (B) Protein localization analysis by immunofluorescence using primary antibodies against E-cadherin (red), ERAP2, and HLA-C (green). ERAP2 expression was undetectable in all cell lines. HLA-C expression detected in BeWo, JEG-3, and T3M-3. HLA-C was not detected in JAr cells. (C) Western blot analysis of cells stimulated by IFNγ. Protein was extracted from cell lines with or without IFNγ treatment. Western blot analysis showed that T3M-3 is the only one undetectable level of ERAP1. Noticeably, the unstimulated cells lacked ERAP2 detection and only the JAr and T3M-3 cells produce the detectable level of ERAP2 protein when stimulated with IFNγ. A representation of β-Actin loading control is shown. (D) Densitometry analysis of the ERAP2 expression level. Only JAr and T3M-3 showed a significant increase of ERAP2 expression level with IFNγ treatment (*P = 0.0253, **P = 0.0127). (E) Densitometry analysis of the HLA-C expression level. BeWo and JEG-3 showed a significant increase of HLA-C expression level with IFNγ treatment (*P = 0.0031, **P = 0.0077) but T3M-3 did not show a significant increase of HLA-C expression level with IFNγ treatment (ns P = 0.0619). Each experiment was repeated three times with three replicates in each experiment.

