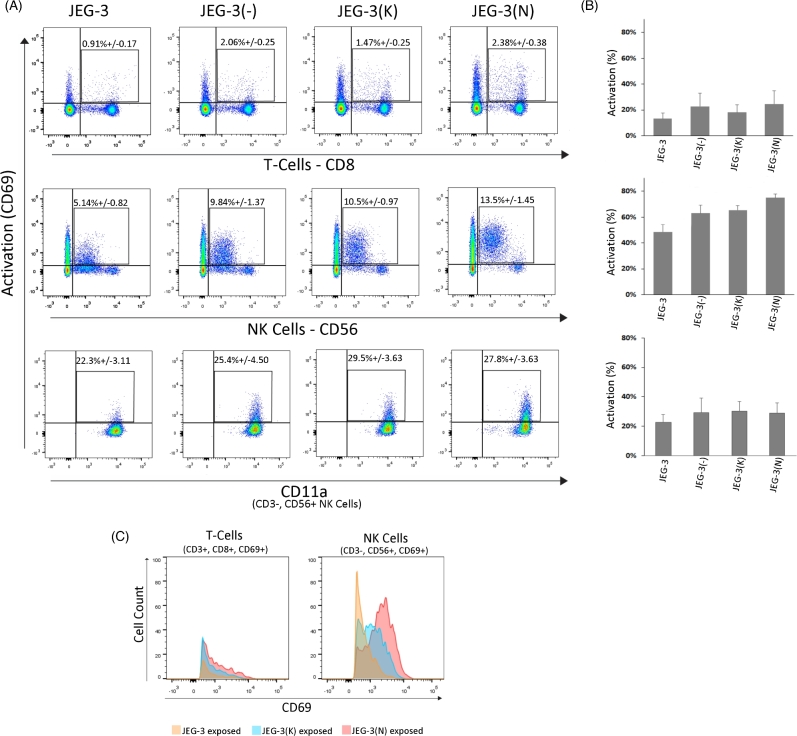
Figure 5.
N392 ERAP2 causes differential lymphocyte activation. (A) Representative dot plot of the flow cytometry analysis performed with PBMCs with HLA-C haplotype Cw03 and Cw06. The average percentage of T cells (CD3+, CD8+), NK cells (CD3–, CD56+), and both for CD69+ activation marker from the total number of lymphocytes is demonstrated. CD11a+ T and NK cells surface marker indicative of attachment and killing was also observed. There was no significant difference in CD11a expression level between the lymphocytes exposed to cells expressing ERAP2 isoforms and those that were not transfected. (B) The bar graphs show the percent activation of T and NK-cell populations exposed to transfected and nontransfected JEG-3 cells. There were no statistically significant differences across experimental groups (P > 0.05, n = 3). (C) Overlay histogram of PBMCs exposed to transfected and nontransfected JEG-3 cells shows that activated T cells are relatively the same between treatments. However, NK cells exposed to N392 ERAP2-expressing JEG-3 cells show a shift in intensity of the CD69+ activation maker. All experiments repeated at least three times with three replicates in each experimental group.

