Figure 6.
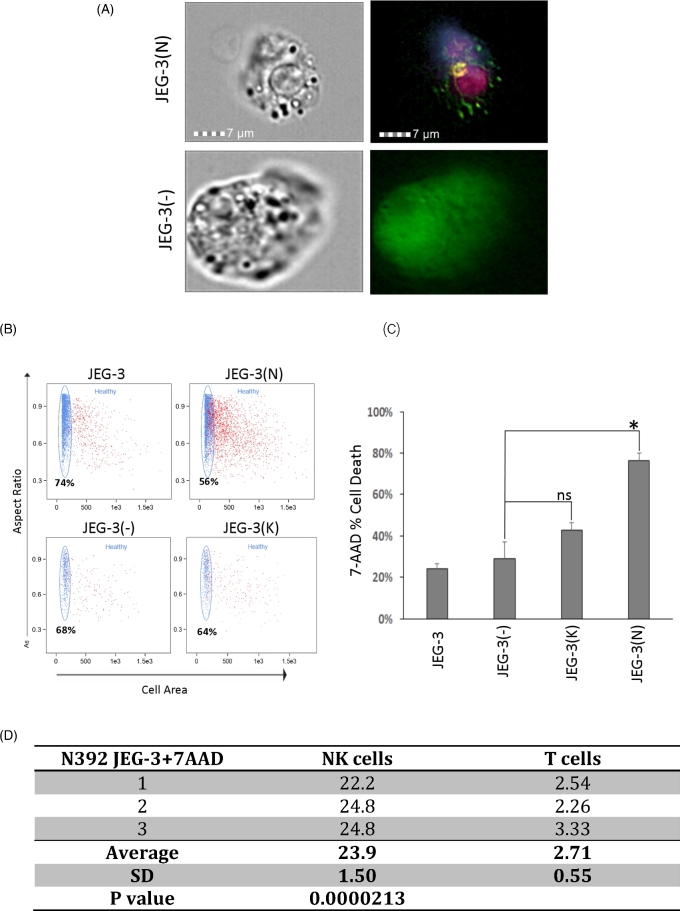
Lymphocytes attach and kill trophoblasts expressing ERAP2. (A) A transfected GFP-producing JEG-3 trophoblast cell can be seen with a T cell and NK cell attached. The T cell is labeled with APC/Fire 750 anti-CD3 (dark pink) and the NK cell is labeled with PE–CD56 (yellow) and BV421 anti-CD40L (purple). Cells transfected with the empty vector (GFP+ = green) are larger and healthier and do not have T or NK cells attached. (B) Dot plots from flow cytometry showed differences in the healthy populations between cells transfected with N392 or K392 ERAP2, or an empty vector and nontransfected cells when exposed to PBMCs. Live, rounded, and healthy cells appear on the top left plot along the left vertical axis. The percentage represents the amount of gated “healthy” cells. Red cells have a varying degree of 7AAD stain. (C) The bar graph shows the percentage of apoptotic cells stained positive with 7AAD in transfected in all experimental groups compared to JEG-3 nontransfected and JEG-3 transfected with a vector without ERAP2. Cytotoxicity assays were run three times with up to three replicates of each experimental groups. The significant cell death observed in JEG-3 cells expressing N392 ERAP2 isoform (*P = 0.040). (D) The table displays the percentage of NK or T cell bound 7AAD positive N392 ERAP2 JEG-3 cells and the significant difference between the two cell types was calculated using the Student t-test (P = 0.0000213). SD, standard deviation.

