Figure 4.
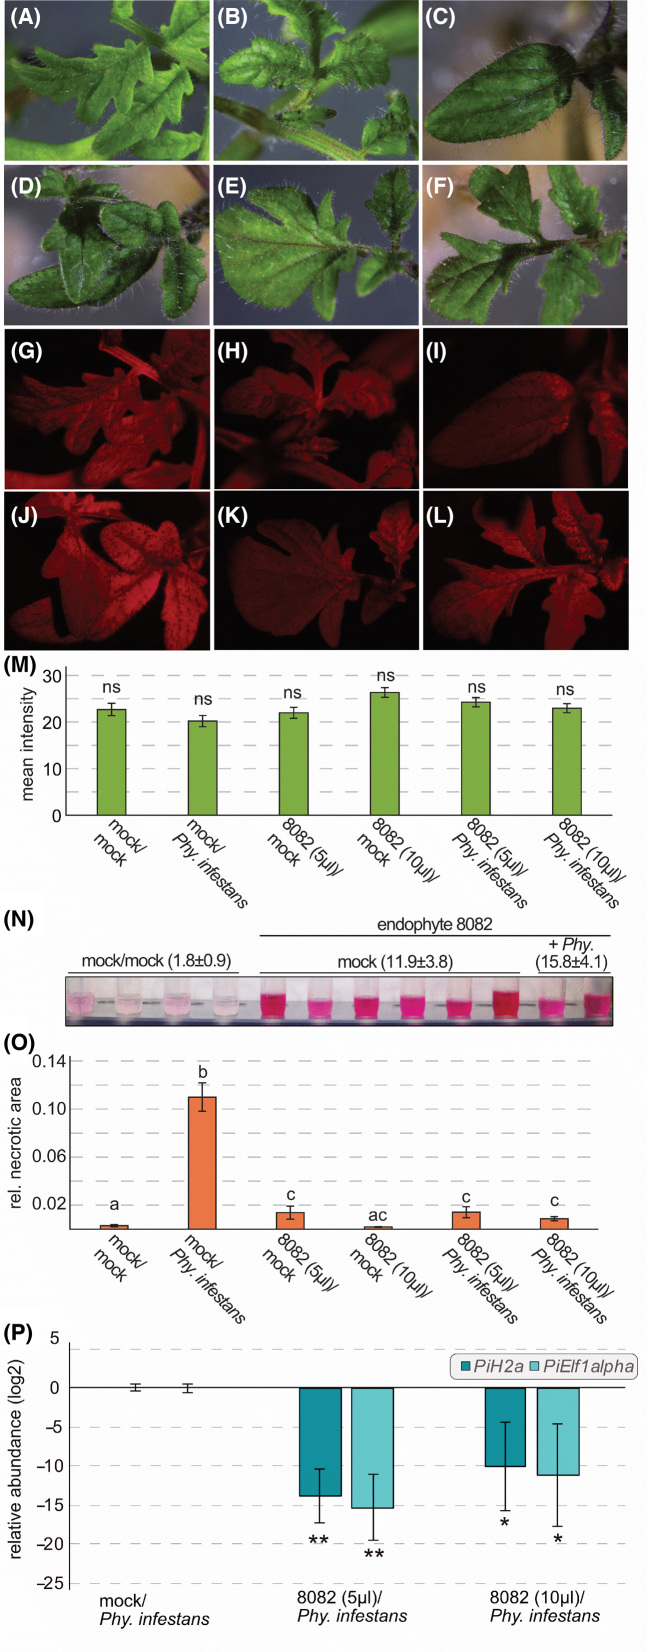
In planta co-inoculations of Phoma eupatorii isolate 8082 and Phytophthora infestans. Solanum lycopersicum cv. M82 seedlings were mock treated (A) or inoculated with Phy. infestans isolate D12-2 (B), 5 µl of Pho. eupatorii mycelium suspension (C), 10 µl of Pho. eupatorii mycelium suspension (D), 5 µl of Pho. eupatorii mycelium suspension and Phy. infestans isolate D12-2 (E) and 10 µl of Pho. eupatorii mycelium suspension and Phy. infestans isolate D12-2 (F). Chlorophyll fluorescence is depicted in red false coloring for all combinations (G-L) and was measured as mean fluorescence intensity using ImageJ2 (M). Bars give the average mean fluorescence (nleaflets = 17–37). Error bars give the standard error of the mean (SEM); ns = not significant. Differences in anthocyanin content (N). A darker pink in the examples shown indicates a higher concentration of anthocyanins in the sample. Average relative anthocyanin content with standard deviation is given in brackets following each treatment. In total, three to six biological replicates per treatment were analyzed. The average relative necrotic area of the leaflets was calculated for each treatment (nleaflets = 38–156). Bars give the average necrotic area per treatment and error bars indicate the SEM. Significant differences between the treatments are indicated by different letters above the bars with a cutoff of P < 0.05; same letter = not significant. The relative abundance of Phy. infestans isolate D12-2 was measured with a qRT-PCR of the two biomass marker genes PiH2a and PiElf1α (P). Bars show average relative expression of the two biomass markers normalized against the three plant reference genes SAND, TIP and TIF3H. It compares relative abundance of Phy. infestans in Pho. eupatorii–Phy. infestans co-inoculations with that in control treatments (Phy. infestans only). Three biological replicates per treatment were used in all cases except for Pho. eupatorii (10 µl mycelial suspension) with Phy. infestans, in which only two biological replicates were used. The error bars indicate the SEM. Significant differences between relative Phy. infestans abundance in samples pre-inoculated with the endophyte and the control are indicated by *P < 0.05 and **P < 0.01. In all bar graphs, treatments with Pho. eupatorii are indicated by its isolate number 8082.

