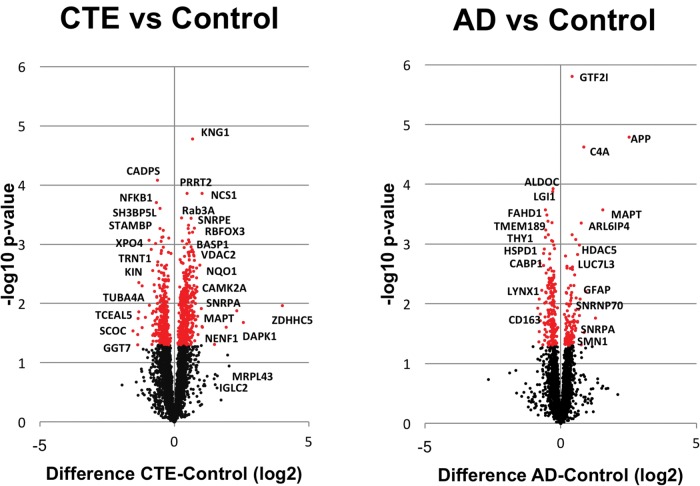
FIGURE 1.
Volcano plots all insoluble brain proteins sequenced from CTE (n = 11) and AD (n = 8) as compared to control cases (n = 6). The plot shows protein abundance, either enriched or reduced (log2-fold-change), against the t-statistic (−log10(p-value)), which is a measure of significance. Red dots are significant differentially expressed proteins (p < 0.05).

