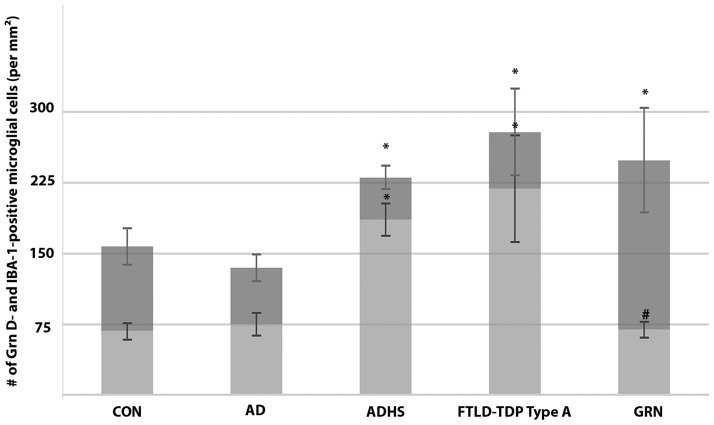
FIGURE 7.
Density of IBA-1- and Grn D-positive microglia in hippocampal CA1 regions of patients with the different diseases. The full height of each bar (both dark and light gray) represents the average number of IBA-1-positive microglia per mm2 in CA1, while the light gray bar represents that of Grn D-positive microglia. Values are mean ± SD. The densities of IBA-1-positive microglia were compared with the control value by ANOVA with Dunnett's post hoc test (*p < 0.05). The density of Grn D-positive microglia was compared between FTLD-TDP type A with and without GRN mutation, and statistical significance was determined by Student’s t-test (#p < 0.05). CON, normal control; AD, Alzheimer disease; ADHS, Alzheimer disease with hippocampal sclerosis; FTLD-TDP type A, FTLD-TDP type A without GRN mutation; GRN, FTLD-TDP type A with GRN mutation; Grn D, anti-Grn D mAb.

