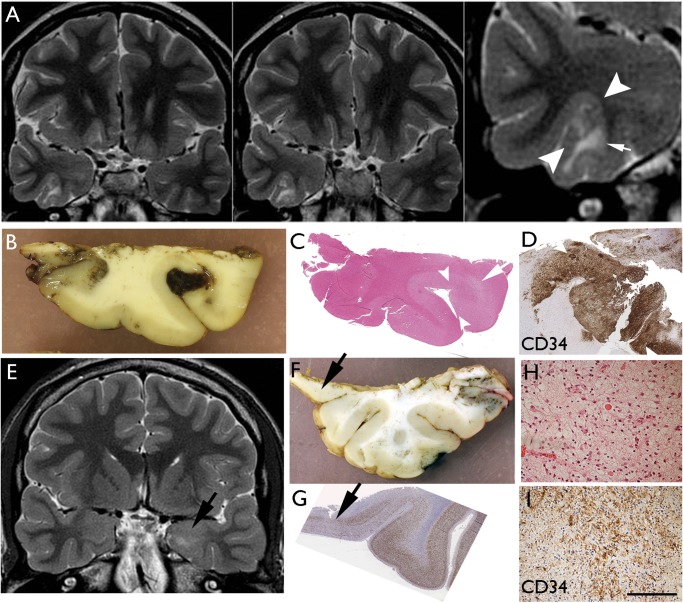
FIGURE 1.
Diffuse GNT. Case 10 (A–D) and Case 19 (E–I). (A) Coronal T2 weighted images showing cortical based lesion of high signal intensity with subcortical white matter involvement involving the right fusiform gyrus. Note the cortical part of the lesion that is creating a bridge into the adjacent sulcus (between arrowheads) shown in higher magnification. There is signal change in the white matter (arrow). (B) Macroscopic image of fixed resection specimen with the slice corresponding to the lesion seen on MRI; there is focal peri-operative acute hemorrhage into the expanded gyrus. (C) H&E-stained section indicates the infiltrated gyrus (between arrows) and underlying rarefaction in the white matter correlating with loss of myelin and axons (arrow). (D) CD34 of the same gyrus at high magnifications shows the diffuse cellular infiltration of the cortex bridging over to the next gyrus. Case 19: (E) dGNT (which also had areas of mixed complex DNT, not shown here) with lesion in MRI in the amygdala (arrow). (F) In the temporal lobe resection, diffuse infiltration was confirmed in the inferior-mesial part of the cortex (arrow). (G) Depletion of neurons seen in this region of diffuse tumors infiltration on NeuN stain (arrow). (H) Diffuse tumor infiltration in the grey matter from the tissue of the lesion in the amygdala. (I) This same region shows CD34 positivity of tumor cells. Bars: D = 500 μm; H, I = ∼300 μm.

