FIGURE 2.
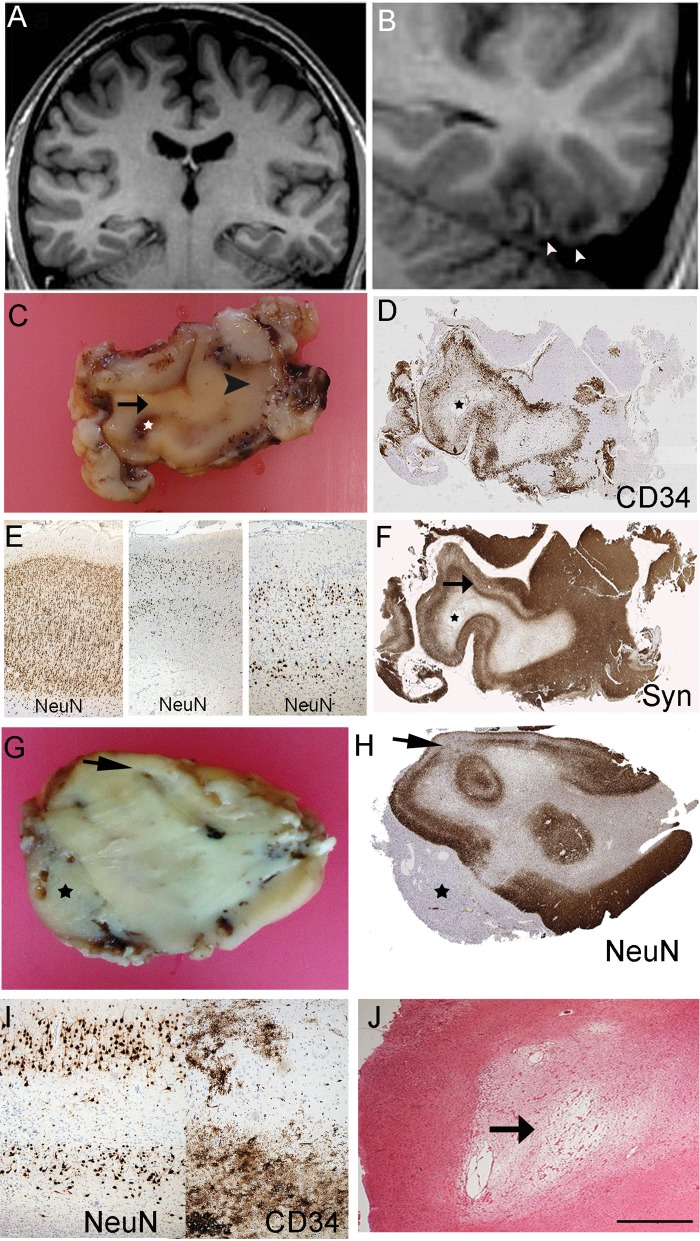
Diffuse DNT with cortical and white matter atrophy. Case 11 (A–F) and Case 9 (G–J). (A) Coronal T1 weighted MR images showing a lesion involving the left fusiform and inferior temporal gyri. (B) The lesion is shown at higher magnification with cortical atrophy with underlying white matter rarefaction in the region of tumor infiltration as well as apparent overlying retraction of cortex and a superficial CSF filled space. (C) The fixed resected specimen showing atrophic discolored cortex (arrowed) and underlying cavitated white matter (star in each image); arrowhead indicates region of normal cortical thickness. (D) CD34 confirmed extensive cortical tumor infiltration in this region. (E) Panel of NeuN showed, on left laminar cortex in preserved region (arrowhead in D) compared with middle and right images of tumor infiltration region with laminar cortical atrophy in region of infiltration. (F) Synaptophysin also highlights laminar neuronal loss in tumor infiltration region (arrow) imparting an impression of cortical “collapse” rather than expansion. Case 9: (G) Macroscopic section of diffuse GNT with evidence of cortical atrophy (arrow) and extension into the leptomeningeal tissues forming a mass (asterisk) and with poor definition between grey and white matter. (H) NeuN on a section from G confirms the thinning and laminar atrophy of the cortex (arrow) and the lack of a ganglion component in the leptomeninges (asterisk). (I) Higher magnification of the region shown by arrow in (H) showing laminar neuronal loss and on CD34 in the same region evidence of tumor infiltration. (J) H&E stain shows focal cavitation and rarefaction of white matter underlying the infiltrated cortex. Bar in J = ∼400 μm.

