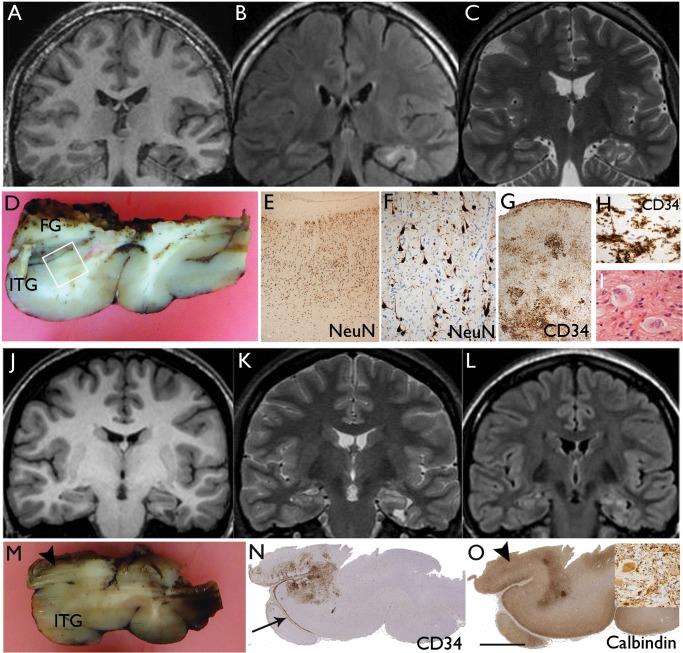
FIGURE 3.
Diffuse GNT with focal gangliogliomatous component. Case 16 (A–H) and Case 17 (J–O). (A) Coronal T1, (B) FLAIR, and (C) T2 weighted MR images showing apparent cortical atrophy underlying white matter signal abnormality with multigyral involvement by the tumor. (D) The main temporal lobe resection specimen included the middle temporal gyrus the inferior temporal gyrus (ITG) and part of the fusiform gyrus (FG). The ITG (shown in square) was infiltrated by a diffuse tumor: (E, F) The same region at higher magnifications shows infiltration of the cortex, reduced neuronal density being “displaced” by NeuN-negative oligodendrocyte-like cells which distort the neuronal morphology. (G) Higher magnification of this same region showing clusters of CD34-positive tumor cells in the cortex and cortical layer I; these are shown in H and in high magnification in I. A sample from the main lesion in the amygdala contained a small focus with atypical gangliod cells. Case 17: (J) Coronal T1, (K) T2, and (L) FLAIR weighted MR images showing left temporal lobe lesion centered on the parahippocampal gyrus with perilesional signal abnormality and cortical atrophy in the adjacent temporal lobe. (M) The main temporal lobe resection including the inferior temporal gyrus (ITG) showed microscopic evidence of diffuse infiltration as shown on CD34 stain in (N); note the widespread labeling of CD34-positive cells along subpial border in layer I (arrow). In deeper sections, a focus of atypical ganglion cells was noted in the superior aspect at the inferior-medial resection margin (arrowhead); (O) this correlated with calbindin positivity and synaptophysin-positive atypical gangliod cells are shown in this region in the inset. Bars: F = 250 μm; G, H, N (inset) = ∼60 μm.

