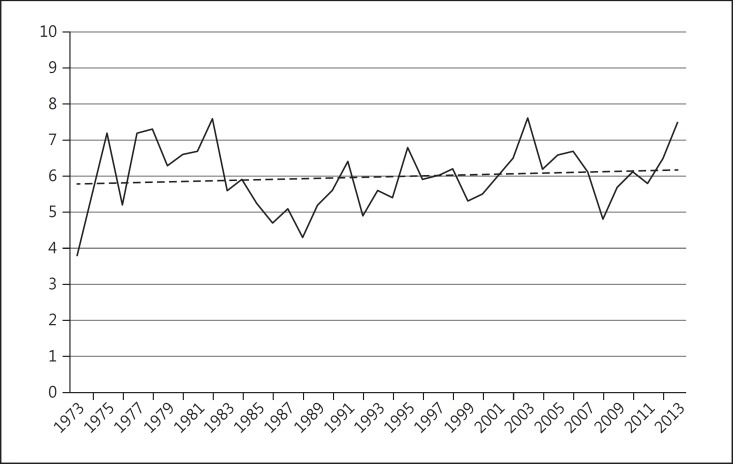
Fig. 2.
Age-adjusted incidence of uveal melanoma, 1973–2013, for Whites only. Number of persons per million population (y axis) adjusted to US 2000 population (uveal melanoma C69.2-C69.4 only). Since 1973, the APC (average annual percent change) was 0.5% (p < 0.05). (Percent changes were calculated using 1 year for each end point; APCs were calculated using the weighted least squares method.)

