. 2018 Apr 3;9(15):3820–3827. doi: 10.1039/c8sc00074c

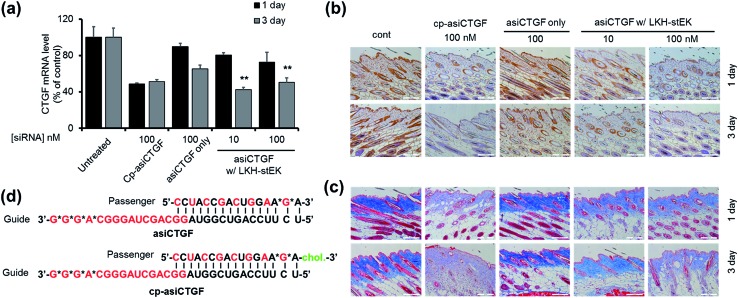
Fig. 6. In vivo analysis of asiCTGF using LKH-stEK. (a) Repression of target mRNA by asiCTGF delivered by LKH-stEK in mouse skin through intradermal injection, 0.4 pmoles (10 nM) and 4 pmoles (100 nM) per injection. After 1 or 3 days, total RNA extracted from the skin of treated mice (n = 5/group) was reverse transcribed, and CTGF mRNA levels were quantified by using qRT-PCR. Mouse CTGF levels were normalized to GAPDH levels (mean ± s.e.). The marker (**) indicates P < 0.01 compared with the siRNA only groups. (b) Repression of CTGF protein expression was examined by immunohistochemistry on day 3. CTGF protein was stained with brown color. Magnification ×200. (c) Collagen deposition represented through Masson's Trichrome staining. Magnification ×200. (d) Schematic presentation of duplex asiCTGF and cp-asi-CTGF. Red characters indicate 2′-O-methyl modification and asterisks indicate phosphorothioate modification. Cholesterol modification is shown in green. Animal studies were carried out in accordance with the 8th edition of the Guide for the Care and Use of Laboratory Animals (National Research Council, 2011), and the protocol was approved by the Institutional Animal Care and Use Committee (IACUC) at the Hugel, Inc.

Fig. 6