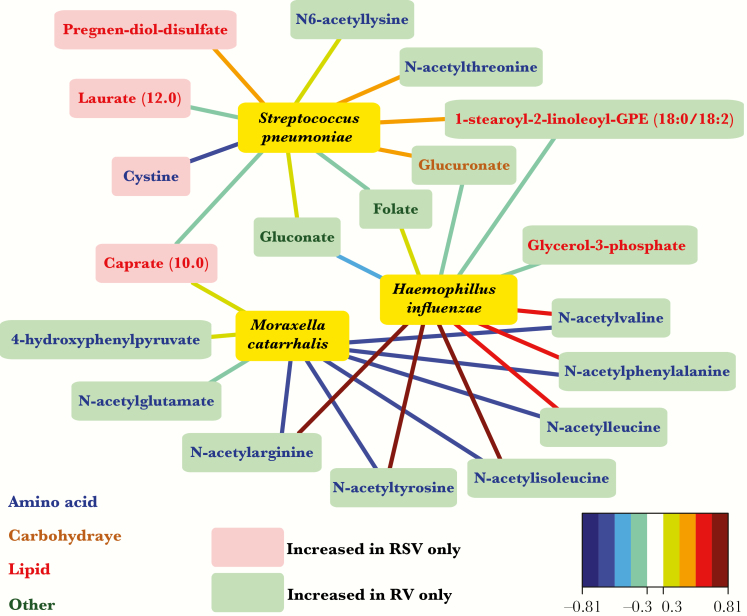
Figure 3.
Association of infants hospitalized with respiratory syncytial virus (RSV)–only and rhinovirus (RV)–only bronchiolitis with the nasopharyngeal microbiota. Analysis includes 106 infants. Network plot showing all correlations >0.5 between the relative abundance of the 3 dominant bacterial genera (yellow) and the 31 significant metabolites in RSV (red) or RV (green) infection. Nodes are colored red or green according to the significantly increased metabolite in RSV or RV infection. The metabolite names are colored according to the super-pathway. Edges are colored by canonical sparse partial least squares correlations. Relative abundance for the 3 dominant genera is based on 16S ribosomal RNA gene sequencing. Operational taxonomic units were identified to the species level, based on metagenomic data.

