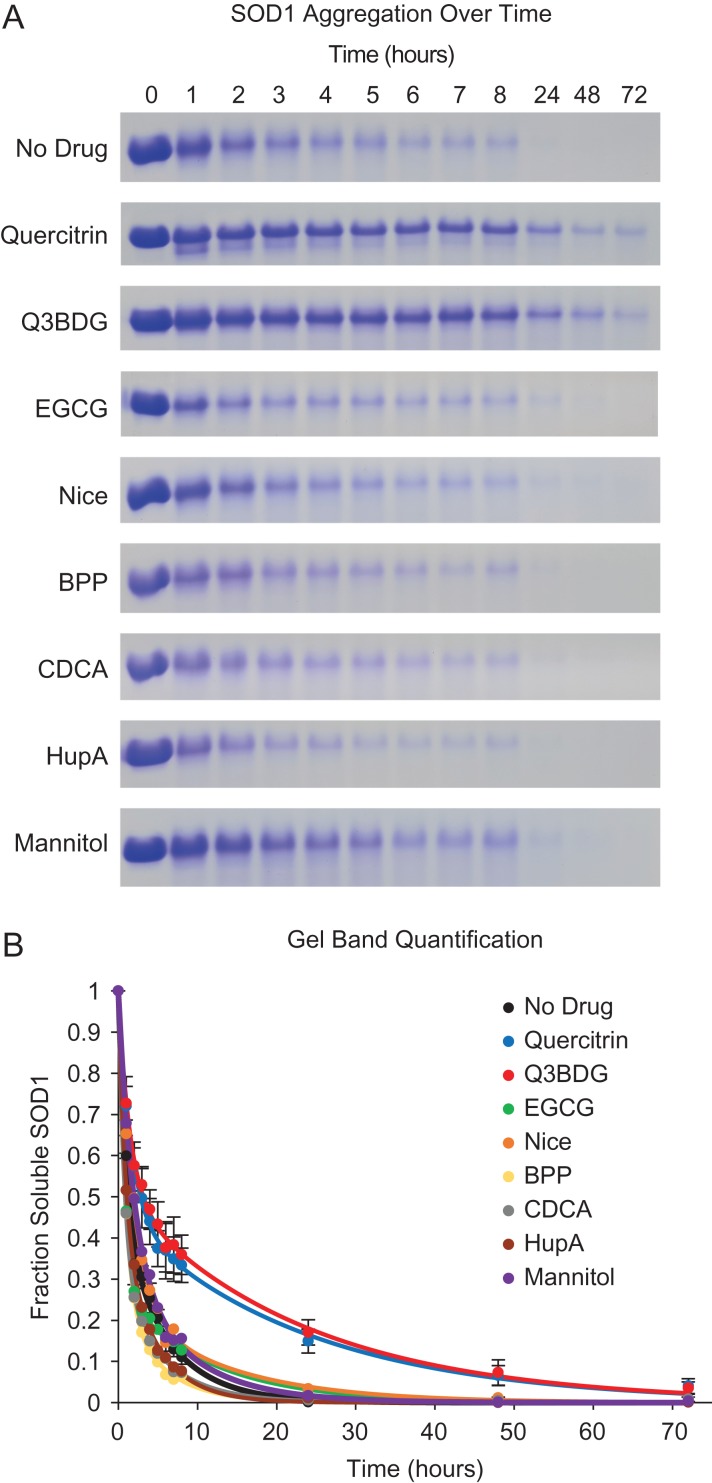
Fig. 2.
A4V SOD1 oxidation-induced aggregation and its inhibition with quercitrin and Q3BDG. A4V SOD1 aggregation was induced with H2O2 at 37°C over various amounts of time in the presence and absence of small molecules. Samples were then centrifuged, and the supernatants were run on SDS-PAGE. (A) Representative SDS-PAGE gel cut-outs stained with Coomassie Brilliant Blue are shown. The bands displayed correspond to monomeric SOD1. (B) The band densities were quantified using ImageJ software. These values were normalized to the untreated (0 time point) and no drug controls as shown in Equation (1). These band density curves were fit to Equation (2) using Origin 9 software. The graph depicts the average of three replicates for each sample. For image clarity, error bars representing the standard error of the mean are only shown for the no drug, quercitrin, and Q3BDG samples.

