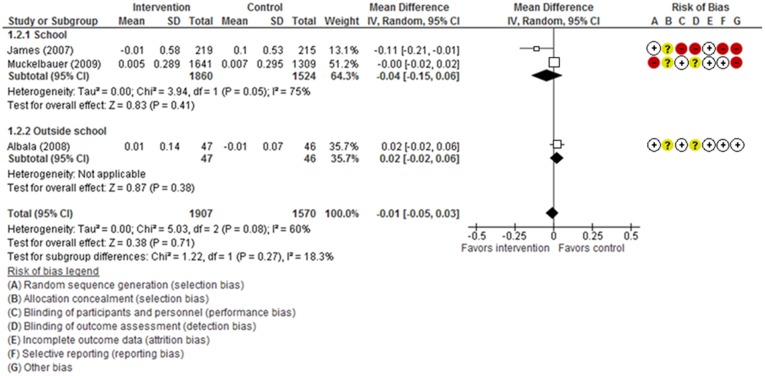
Figure 3.
Forest plot showing the reduction in body mass index (BMI) z scores in the intervention group relative to the control group (no intervention) among children in schools (1.3.1), outside schools (1.3.2), and overall. A random-effects model method was employed to calculate standardized mean difference with 95%CIs.

