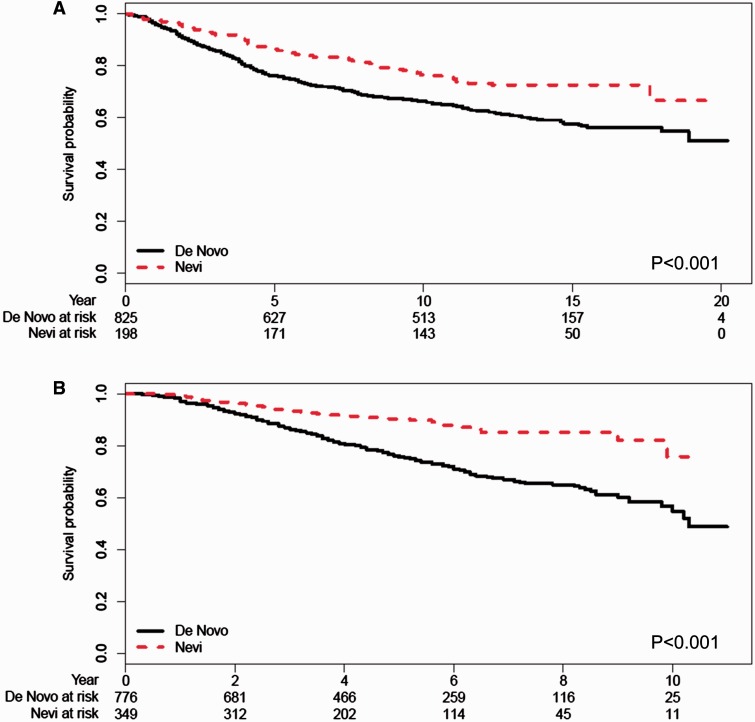
Figure 1.
Overall survival stratified by de novo ( solid lines ) or nevus-associated ( dashed lines ) melanoma classification. A) NYU1 cohort. B) NYU2 cohort. Tables of the numbers of patients at risk at different time points are given below each graph. P values are calculated based on two-sided log-rank test.

