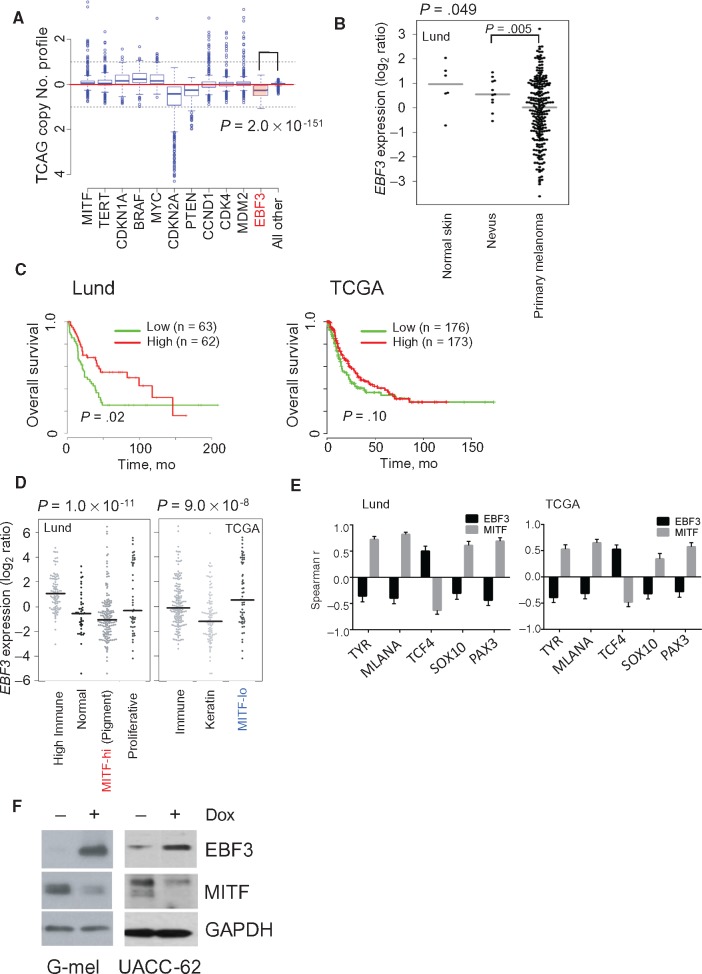
Figure 3.
EBF3 validation. A) Copy number profile of EBF3 (shaded red box) and various melanoma drivers among The Cancer Genome Atlas (TCGA) tumor specimens. A two-sided Wilcoxon test was used to compute P values. B)EBF3 expression in normal skin, benign nevi, and primary melanoma. P values were calculated using a two-sided Wilcoxon test. C) Lund University Medical Center and TCGA patient survival with metastatic melanoma with high and low EBF3 expression. Two-sided Cox proportional model was used to estimate significance. D)EBF3 expression in different molecular subtypes of melanoma. E) Spearman correlations for both EBF3 and MITF and melanocyte lineage genes in the Lund and TCGA data sets (error bars indicate 95% confidence interval). F) Induction of EBF3 in G-mel and UACC-62 cells using a Tet-responsive promoter. Dox = doxycycline; TCGA = The Cancer Genome Atlas.

