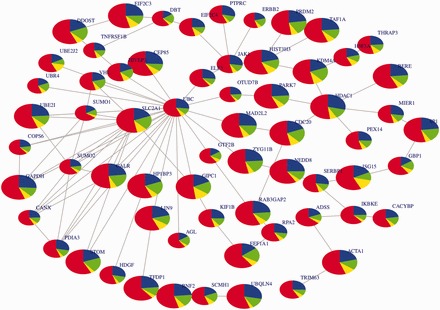
Fig. 2.

Central sub-network from the top 20 ranked sub-networks on the causal simulation data of a 4-way admixed population. The central sub-network in this figure is highly connected and related to the Integrin family cell surface interactions pathway (z-score of overlap = 1.6). The size of a node denotes its statistical significance from small to large. Nodes are coloured according to the ancestry proportions: red = YRI (Yoruba ancestry), blue = CEU (European ancestry), green = CHB (Chinese ancestry) and yellow = GIH (Gujarati Indian ancestry)
