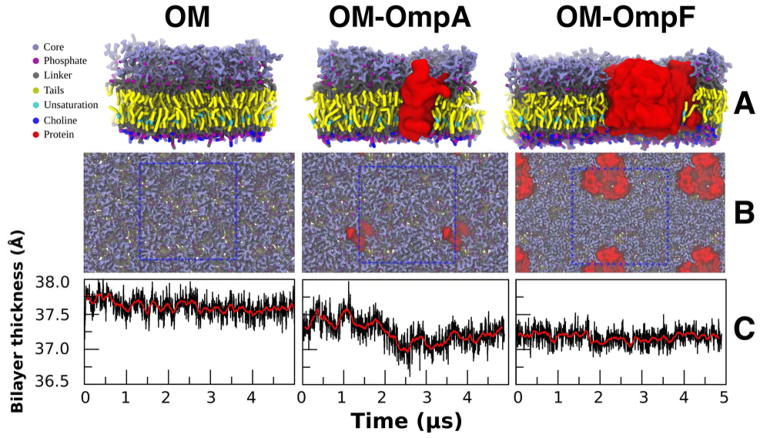
Figure 3.
(A, B) The side and top view of the final snapshot of 5 μs simulations (at 310 K and 1 bar) of different Ra LPS systems. The unit cells are depicted by a blue dotted wireframe. (C) The OM thickness varied only little over the span of the simulation for each system (the red line shows the running average; n=20).

