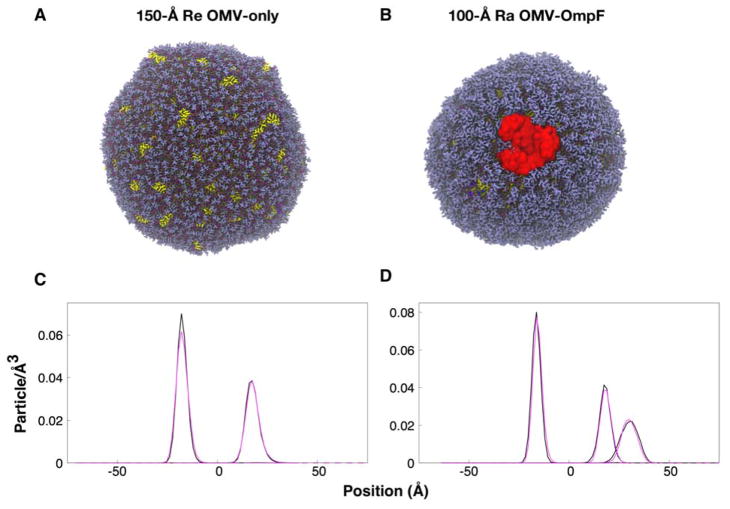
Figure 5.
(A, B) OMVs structures and (C, D) Re and Ra LPS phosphate particle positions. The color scheme in (A) and (B) is the same as in Figure 3, and water beads are omitted for clarity. The phosphate particle positions are shown relative to the center of mass of the vesicle bilayers, and the average ROMV is at position 0. The black line shows data for (C) 150-Å Re OMV-only and (D) 150-Å Ra OMV-only, while the magenta line shows data for (C) 150-Å Re OMV-OmpF and (D) 100-Å Ra OMV-OmpF. Note that there are two phosphate density profiles in (D) Ra OMVs in the outer leaflet, one from lipid A and the other from the core region.

