Fig. 1.
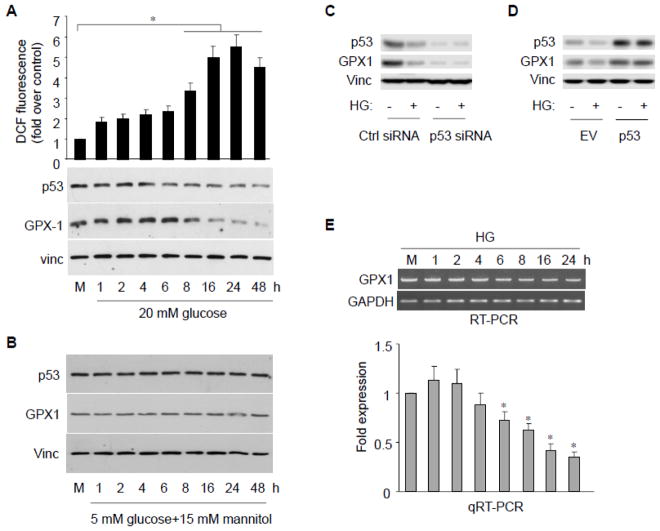
High glucose exposure inhibits GPX1 and increases ROS formation in endothelial cells. A, B, HAECs were treated with high glucose (20 mM) or with osmotic control (5 mM glucose + 15 mM mannitol) at various times. The p53 and GPX1 protein were assayed by immunobloting. Intracellular ROS was assessed by fluorescence intensity of dichlorofluorescin (DCF fluorescence) emission. Data are presented as mean fold increases (±SD) in treated groups over basal values from three independent experiments. *p<0.05 versus controls. C, HAECs were transfected with either p53 or control siRNA. The p53 and GPX1 protein were assayed by immunobloting. D, HAECs were transfected with either p53 or empty vector (EV). The p53 and GPX1 protein were assayed by immunobloting. E, RT-PCR or qRT-PCR analysis reveals GPX1 mRNA levels at the time points following HG treatment. The blot is a representative of 3 blots from 3 independent experiments (n = 3 each). Results are expressed as mean ± SD. *p<0.05 vs. control.

