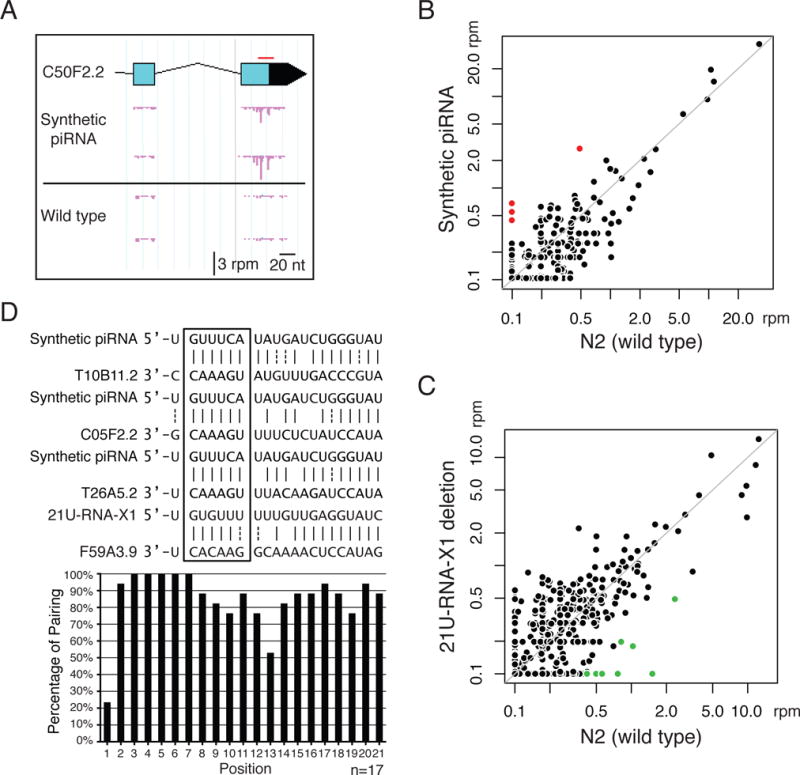
Fig. 1. 22G-RNA loci as a proxy to identify the targets of specific piRNAs.

(A) An example of 22G-RNA distributions at one of the RNA targets of the synthetic piRNA (GFP-targeting piRNA#1) in the indicated strains with biological replicates. Each pink bar indicates the 1st nucleotide position and abundance of 22G-RNAs. The red bar marks the position targeted by the synthetic piRNA. rpm: reads per million.
(B) A scatter plot showing the abundance of 22G-RNAs around each potential targeting site (100nt window centered with each target site) of the synthetic piRNA (GFP-targeting #1) in the control strain and in the strain expressing the synthetic piRNA. Note that the potential targeting sites are sites of RNA transcripts that pair to the specific piRNA with six or fewer mismatches. Marked in red are sites at which 22G-RNA levels increased over 4 fold in the strain expressing the synthetic piRNA relative to the control strain.
(C) A scatter plot showing the abundance of 22G-RNAs at each potential targeting site of 21U-RNA-X1 in the N2 (wild-type) strain and in the strain containing a deletion of the 21U-RNA-X1 coding loci. Marked in green are sites at which 22G-RNA levels decreased over 4 fold in the strain loss of 21U-RNA-X1 relative to the N2 wild type.
(D) The pairing between piRNAs and identified targets. Examples of pairings between the piRNAs and their targets (Top). A bar graph showing the percentage of base pairing at each position within the piRNAs with all 17 identified targets (Bottom). GU wobble pairing is considered as paired here to highlight the near-perfect pairing at the seed region when GU pair is allowed.
