
Fig. 4. Germline-expressed genes exhibit resistance to piRNA silencing through their intrinsic signals, such as PATCs.
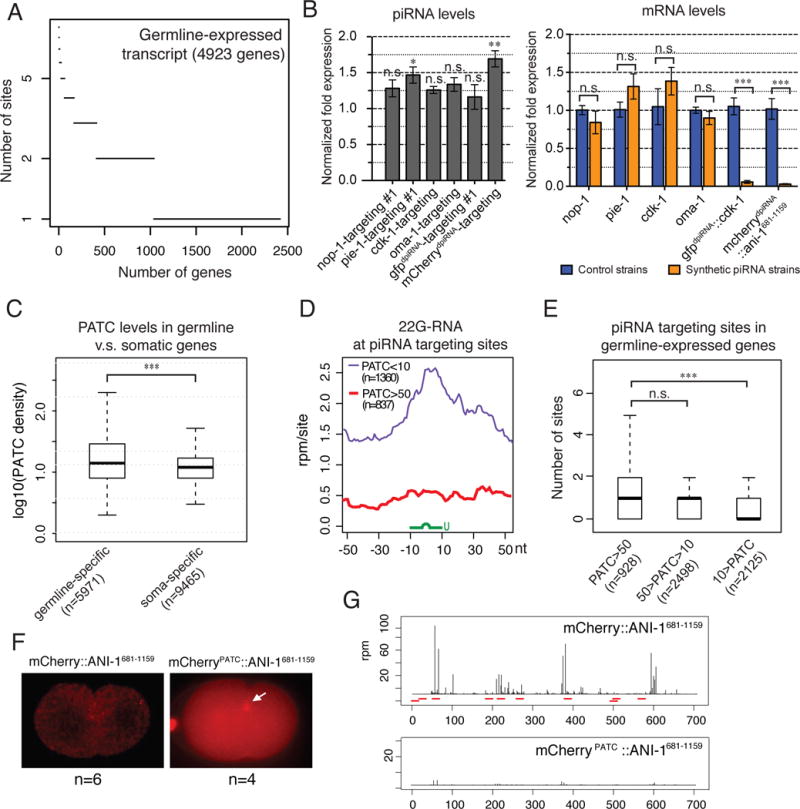
(A) Numbers of predicted piRNA sites on germline-expressed RNA transcripts. To predict more confident targeting sites, the stringent piRNA targeting criteria are used here, where up to one GU wobble pair was allowed in the seed region, and overall only up to two mismatches plus an additional GU mismatch were allowed. In addition, the mismatch at the first nucleotide of the piRNA is not counted/considered. The RNA targets of CSR-1 Argonaute (CSR-1 targets) are used to define the germline-expressed genes.
(B) qRT-PCR measurements of the abundance of the synthetic piRNAs in comparison to the level of endogenous 21U-5499 (value=1) in the control strain (left) and the expression levels of corresponding mRNA targets in the indicated strains (right). Note that nop-1, cdk-1, and oma-1 targeting piRNAs were produced by gene-edited animals, whereas pie-1-targeting piRNAs were produced by animals carrying extrachromosomal arrays. Error bars represent standard error of the mean from biological duplicated samples. The statistics for synthetic piRNA expression were calculated by comparing the levels of specific piRNAs and 21U-5499. n.s.: not significant, *: p-value<0.05, **: p-value <0.01, ***: p-value <0.001, t-test.
(C) A box and whisker blot showing the density of PATC in the germline-specific and somatic specific genes. ***: p-value <0.001, t-test.
(D) The density of 22G-RNAs within a 100 nt window around predicted piRNA target sites of germline-specific transcripts with high PATC density (PATC>50) or low PATC density (PATC<10). The plots are centered at sequence targeted by piRNAs (green). The stringent piRNA targeting criteria were used here to predict piRNA target sites. n = number of predicted piRNA sites.
(E) The box-and-whisker plots showing the number of predicted piRNA targeted sites on germline-expressed genes that contain the indicated range of PATC density. The stringent piRNA targeting criteria were used here to predict piRNA target sites. n.s.: not significant, ***: p-value <0.001, t-test.
(F) Fluorescence micrographs showing the expression of the original mCherry∷ANI-1681-1159 harboring synthetic introns (no PATC) and mCherryPATC∷ANI-1681-1159 harboring PATC-containing introns.
(G) 22G-RNA distribution at mCherry coding sequence of the indicated transgenes. Each bar indicates the 1st nucleotide position and abundance of 22G-RNAs. The red bars mark the location of piRNA targeting sites predicted by using the relaxed piRNA targeting criteria.