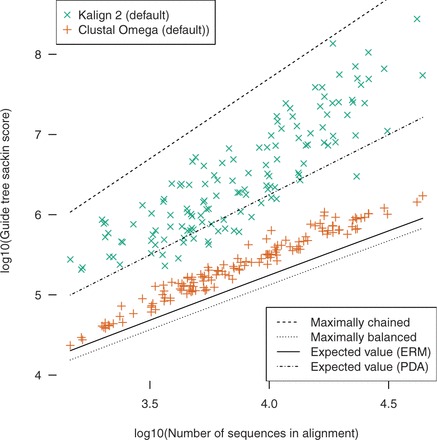
Fig. 2.

Comparison of Kalign 2 and Clustal Omega guide tree imbalance. The Sackin score (sum of distances from leaves to root) produced by each program is plotted against the number of sequences in the alignment for each test case. Values for fully chained and balanced trees and expected values under the Equal Rates Markov and Proportional to Distinguishable Arrangements models of tree growth are indicated with lines
