Fig. 3.

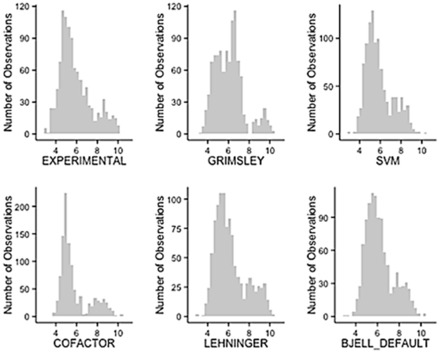
Distribution of isoelectric point for different methods and the experimental distribution. The y-axis is the number of proteins for the corresponding isoelectric point value (x-axis)

Distribution of isoelectric point for different methods and the experimental distribution. The y-axis is the number of proteins for the corresponding isoelectric point value (x-axis)