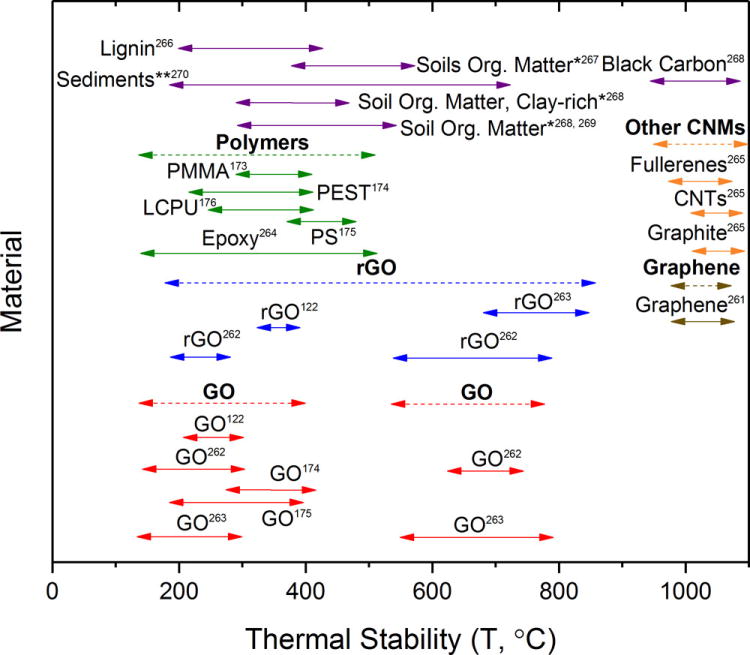
Figure 3.

The thermal stability as a function of mass loss for graphene,261 graphene oxide122, 174, 175, 262, 263 and reduced graphene oxide122, 262, 263 relative to polymer matrices (LCPU = liquid crystalline polyurethane, PS = polystyrene, PMMA = poly(methyl methacrylate), PEST = polyester, and epoxy),173–176, 264 other carbonaceous nanomaterials,265 and plant material (lignin),266 soils or soil materials,267–269 and sediments.270 An asterisk (*) indicates that clay was not included as part of the thermal gravimetric analysis (TGA) profile while a double asterisk (**) indicates that clay was included as part of the TGA profile. The plot shows where overlap can occur between the thermal profile of the CNM and the thermal profile of the matrix. Ranges provided are the most dramatic change(s) observed with TGA under inert conditions (N2 or Ar) with ramp rates ranging from 5 °C/min to 20 °C/min.
