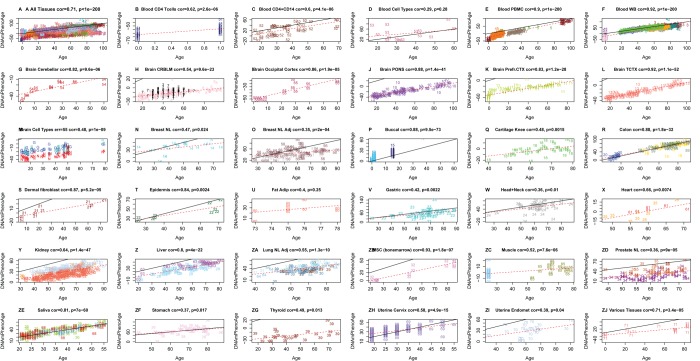
Figure 3.
Chronological age versus DNAm PhenoAge in a variety of tissues and cells. Although DNAm PhenoAge was developed using methylation data from whole blood, it also tracks chronological age in a wide variety of tissues and cells. (A) The correlation across all tissues/cells we examined is r=0.71. (B-ZJ) report results in different sources of DNA as indicated in panel headings. The numbers correspond to the data sets from (Horvath 2013). Overall, correlations range from r=0.35 (breast, panel O) to r=0.92 (temporal cortex in brain, panel L).

