Figure 3.
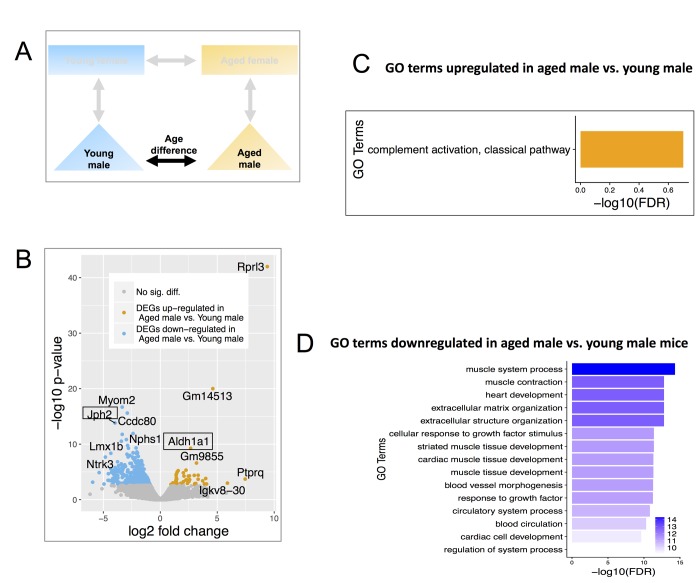
Differentially expressed genes (DEGs) and enriched GO terms in aged male vs. young male. (A) Comparisons include age and males only. (B) Volcano plot showing upregulated (mustard) and down-regulated (blue) DEGs with a minimum 1.5-fold change and a FDR <0.1. Text boxes highlight individual genes discussed in results section. (C) Gene ontology terms significantly enriched in genes significantly up-regulated in aged male vs. young male. Many of these GO terms are related to immune responses and differ from those enriched in aged female vs young female mice. (D) Significantly enriched Gene Ontology terms down-regulated genes in aged male vs. young male. These genes are interestingly related to muscles and were also not identified as enriched in aged female vs young female mice. The results are consistent with the notion of distinct differences in the aging process between males and females.

