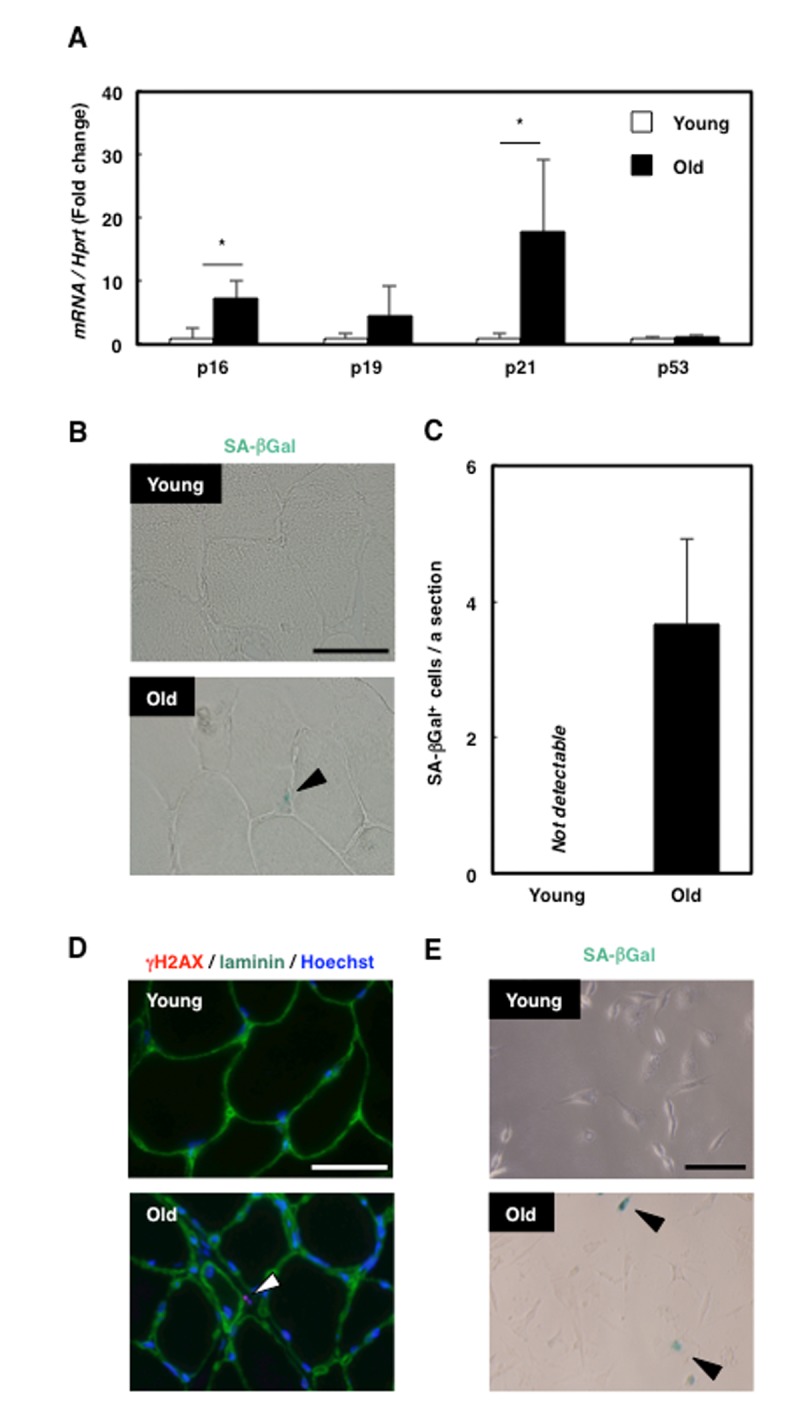
Figure 1.

Senescent mesenchymal cells appeared in old rat skeletal muscle. (A) Quantification of mRNA levels of senescence markers in young and old rat skeletal muscle. Data are expressed as means±SE (n=4); *P<0.05. (B) SA-βGal staining in TA muscle sections from young and old rats. Black arrowhead: SA-βGal+ cell. Scale bar: 50 μm. (C) Quantification of SA-βGal+ cells per section. Data are expressed as means±SE (n=3). (D) Immunohistochemical analysis of γH2AX and laminin in TA muscle sections from young and old rats. White arrowhead: γH2AX+ cell. Scale bar: 50 μm. (E) SA-βGal staining of primary skeletal muscle cells from young and old rats. Black arrowheads: SA-βGal+ cells. Scale bar: 50 μm.
