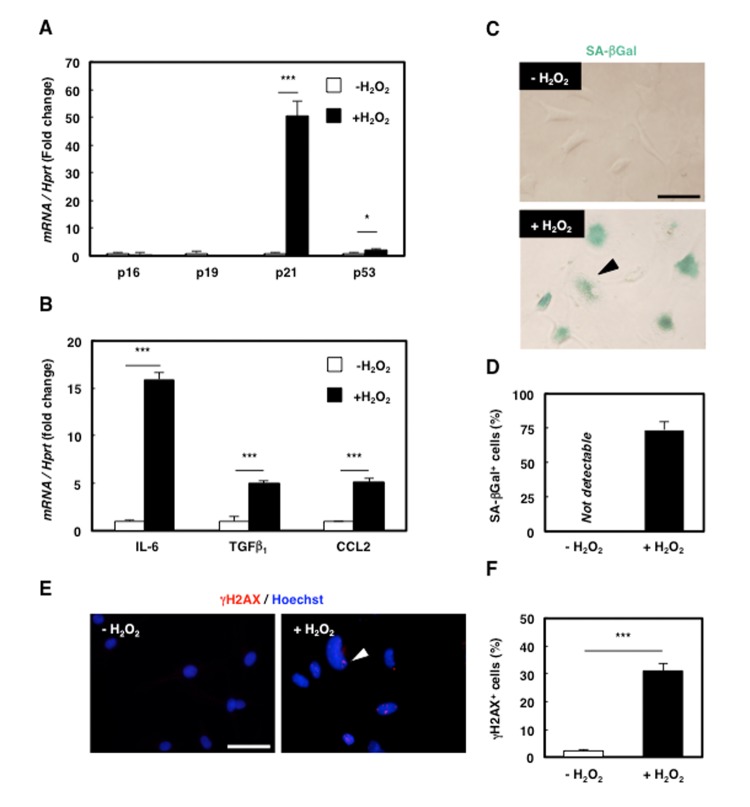
Figure 2.
Senescence was successfully induced in rat mesenchymal cell clone 2G11 cells. (A) Quantification of mRNA levels of senescence markers in 2G11 cells treated with H2O2. Data are expressed as means±SE (n=3); *P<0.05, ***P<0.001. (B) Quantification of mRNA levels of SASP markers in 2G11 cells treated with H2O2. IL-6: interleukin-6; TGFβ1: transforming growth factor β1; CCL2: C-C motif chemokine ligand 2. Data are expressed as means±SE (n=3); *P<0.05, ***P<0.001. (C) SA-βGal staining in 2G11 cells treated with or without H2O2. Arrowhead: SA-βGal+ cell. Scale bar: 50 μm. (D) Quantification of SA-βGal+ cells. Data are expressed as means±SE (n=3). (E) Immunocytochemical analysis of γH2AX in 2G11 cells treated with or without H2O2. Arrowhead: γH2AX+ cell. Scale bar: 50 μm. (F) Quantification of γH2AX+ cells. Data are expressed as means±SE (n=3); ***P<0.001.

