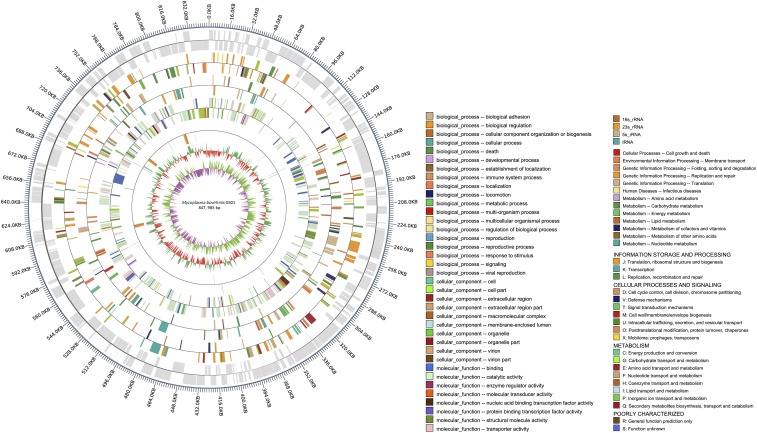
Figure 1.
Chromosome atlas of Mycoplasma bovirhinis strain GS01. dnaA at position 1. From outer to inner circles, the first circle represents the genome position coordinates; the second circle shows the locations of predicted coding genes on plus and minus strands; the third, fourth, and fifth circles show the results of color-coded by COG categories, KEGG, and GO annotation (see the description at the bottom-right corner), respectively; the sixth circle represents the ncRNA in GS01 genome; the seventh circle represents the mean centered G+C content whose baseline is average GC, and outward and inward projections express higher and lower values than the average, respectively; and the eighth circle illustrates the GC (G+C) skew plot: above and below zero are highlighted in green and purple, respectively.

