Figure 4.
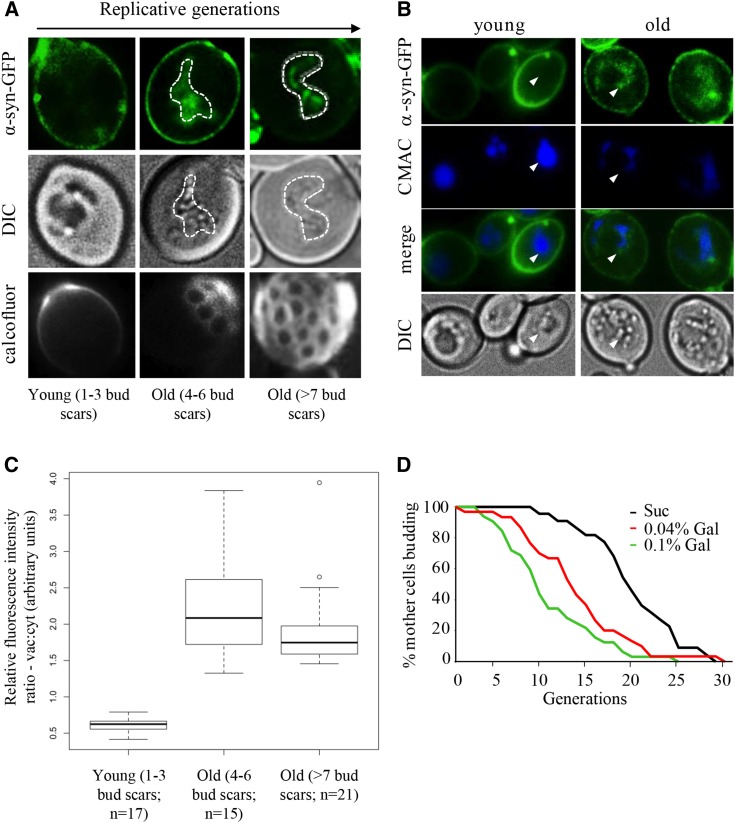
Accumulation of α-syn-GFP protein aggregates in replicatively old yeast. (A) Live single cell confocal imaging of α-syn-GFP in dividing WT yeast cultures. Calcofluor stained bud scars are shown in bottom panels. Vacuole boundaries are marked by white dashed lines. (B) Intravacuolar compartmentalization of protein aggregates in replicatively old yeast. Cells expressing α-syn-GFP were grown in 0.1% galactose and counter stained with CMAC-Arg for 10 min prior to imaging. Arrows denote vacuolar boundaries. (C) Box & whisker plot of vacuolar:cytoplasmic GFP fluorescence ratios in cells undergoing early or late divisions. Digitized fluorescence images were scored by an observer blind to cell age. Mean, and upper and lower quartiles are included. The cells were grouped into 3 age groups, as shown, with the specific (n)s for each group indicated. (D) RLS of WT yeast expressing GAL1-inducible α-syn-GFP grown on YP media supplemented with sucrose (α-syn-GFP “off”) or galactose (α-syn-GFP “on”). Mean lifespan for a population of 40 mother cells is: Suc, 18.2; 0.04% Gal, 12.5; 0.1% Gal, 8.1.

