Figure 7.
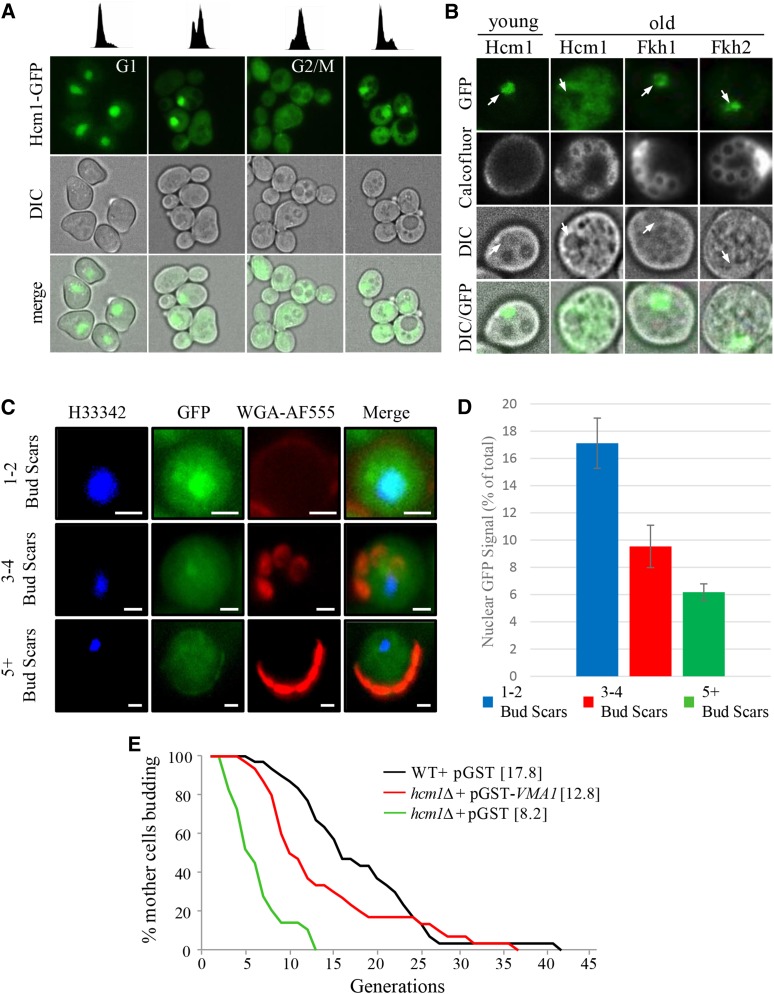
Nuclear exclusion of Hcm1 in replicatively old cells. (A) Nucleocytoplasmic distribution of Hcm1-GFP throughout the cell cycle. Cells were arrested in G1 by α-factor treatment, released into fresh media, and analyzed by flow cytometry at the cell cycle stage indicated (upper panel) and imaged (lower panels). Hcm1-GFP distribution in an asynchronous yeast culture is shown in (Figure S5B). (B) Live single cell fluorescence images of age-dependent Hcm1-GFP distribution. Arrows denote nuclei. Images of Fkh-GFP in age-matched cells are included for comparison. Calcofluor-white stain was added prior to imaging. See Figure S5A for additional images of older Fkh1-GFP, Fkh2-GFP and Hcm1-GFP expressing cells. (C) Live cell imaging of aging Hcm1-GFP cells. Nuclei were imaged using Hoechst (H33342; blue), bud scars were imaged using wheat germ agglutinin-alexafluor 555 conjugate (WGA-AF555; red) and Hcm1-GFP is shown in green (GFP). Cells were binned into cells with 1-2 bud scars, 3-4 bud scars and 5+ bud scars. All imaged cells were unbudded. 20 cells were image for the 1-2 BS group, 12 for the 3-4 BS group and 20 for the 5+ BS group. Representative images are shown. (D) Quantitation of GFP fluorescence intensity. The GFP signal in the cell is the sum of the pixel intensities across the whole cell while the nuclear signal is the sum of the GFP signal in each pixel inside the nucleus. The p-value for the 1-2 BS vs. 3-4 BS groups was 0.002, the p-value for the 1-2 BS vs. 5+ BS groups was 0.7 X 10^-5 (0.000007), and the p-value for the 3-4 BS vs. 5+ BS groups was 0.04. (E) RLS analysis of WT cells and hcm1Δ mutants harboring the indicated plasmids. Cells were maintained on Ura- synthetic media supplemented with 0.1% galactose to induce expression. Expression of VMA1 partially restores the reduced RLS in hcm1Δ cells (P < 0.001). Mean replicative lifespan shown in brackets (n = 40).

