Figure 1.
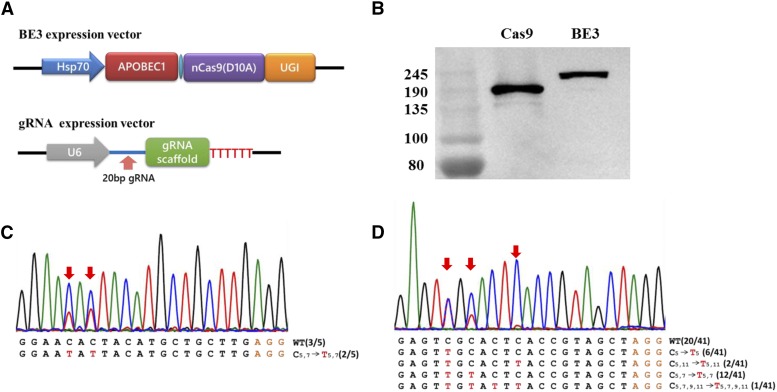
Base editing in B. mori. (A) Schematic representation of the BE3- and gRNA-expression vectors. (B) Detection of BE3 expression in the BmE cell line by western blotting. (C, D) Sanger sequencing of targeted genomic regions of Blos2 and Yellow-e. Red arrows point to overlapping peaks. The orange and red letters mark PAM sites and converted bases, respectively. The numbers in trumpet font indicate the position of C or T.

