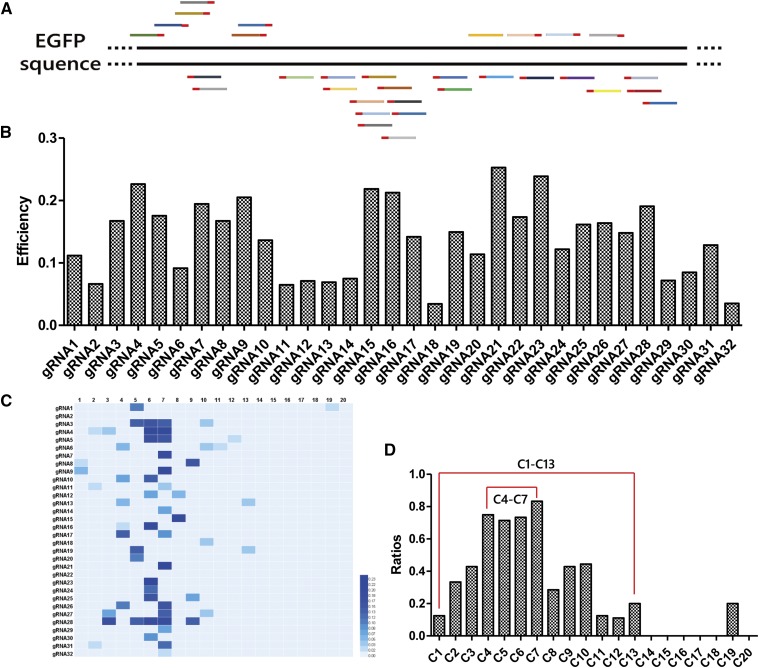
Figure 5.
The efficiencies of 32 EGFP gRNAs and the editing window of BE3 in B. mori. (A) Schematic representation of 32 gRNAs targeting EGFP. (B) Bar graphs show the efficiencies of the 32 gRNAs designed to target EGFP. (C) The heatmap shows the efficiency of each base substitution in each gRNA. The darker the colors are, the more efficient the base substitutions were at the indicated position. (D) Bar graphs showing that the editing window of BE3 in B. mori ranges from C1 to 13C.

