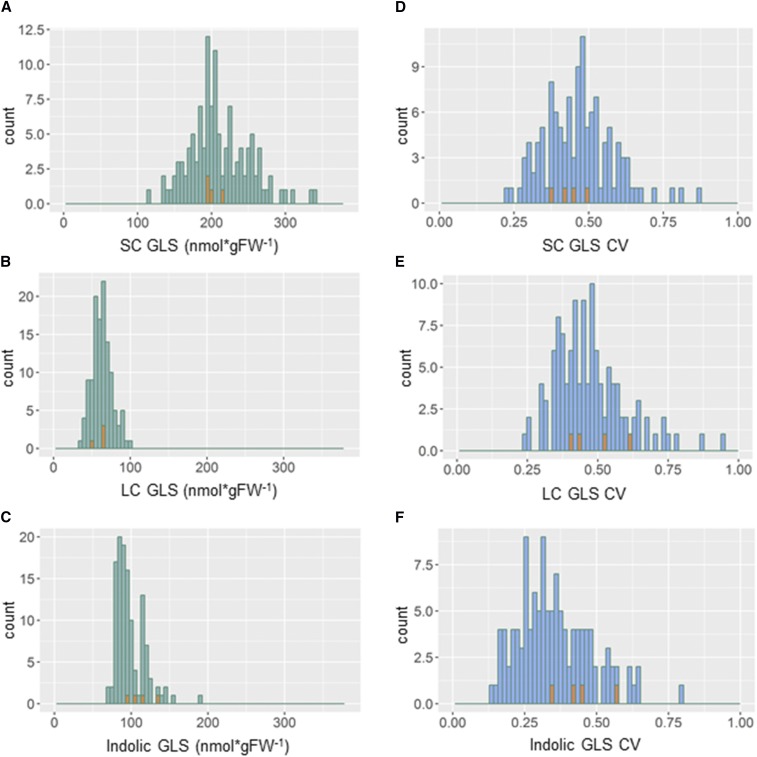
Figure 2.
Distribution of mean and within line (CV) glucosinolate (GLS) traits among the epiRILs. Green bars show the distribution of the mean traits among the epiRILs, blue bars show the histogram of the within line variation among the epiRILs as measured by CV. Orange bars represent the distribution of the corresponding four WT lines for the specific trait shown. A) LSmean SC glucosinolate content, B) LSmean LC glucosinolate content, C) LSmean Indolic glucosinolate content, D) Within line CV for SC glucosinolates, E) Within line CV for LC glucosinolates, F) Within line CV for Indolic glucosinolates.

