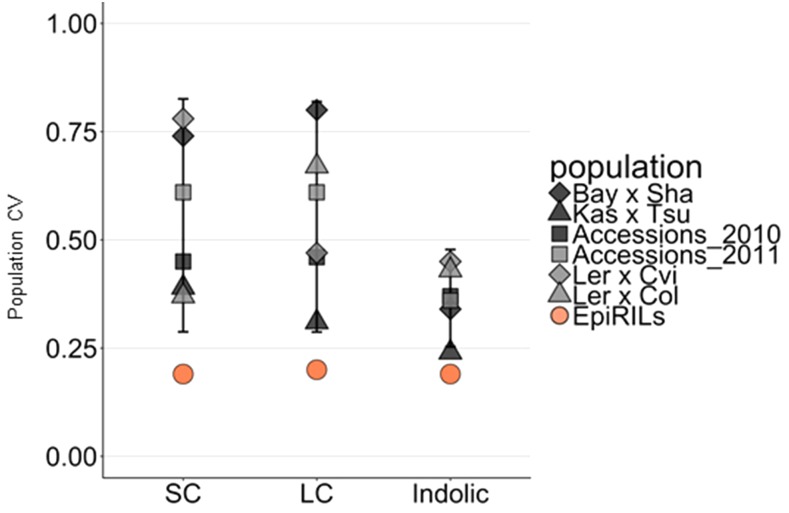
Figure 4.
Meta-analysis of population level variation between epiRILs and genetic populations. The variation within the population (population CV) for mean glucosinolate traits is shown for epiRILs or genetic RILs or genetic association mapping populations are shown. The SC, LC and indolic traits are shown on the x-axis. Error bars for each glucosinolate mark the 99th percentile confidence interval for the genetically variable populations (RILs and accessions).

