Figure 6.
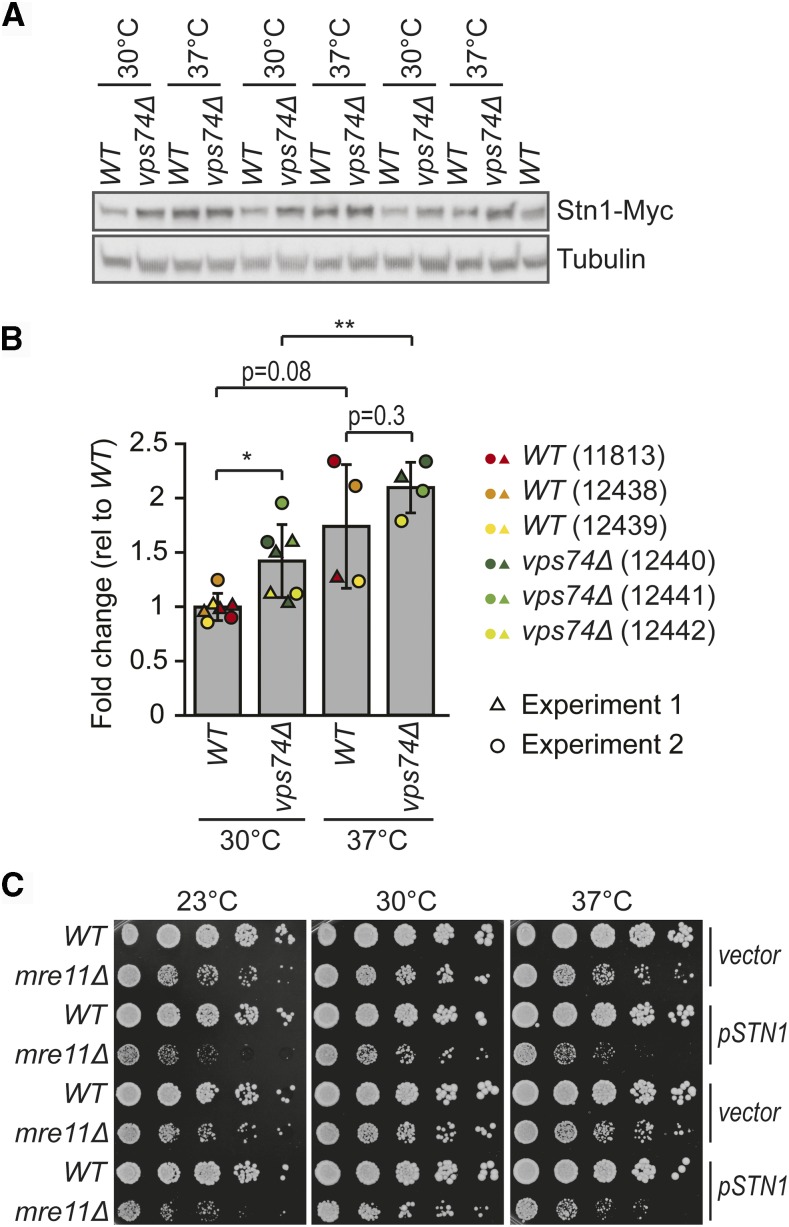
Increased temperature and loss of Vps74 leads to increased Stn1-Myc levels. Three independent WT and vps74Δ strains carrying a Stn1-Myc construct (strains numbers indicated), were cultured overnight at 30°C to saturation. Each culture was diluted 1:100, cultured for 2h at 30°C and then divided into two cultures that were further incubated at 30°C or 37°C for 4h. (A) Proteins were extracted using TCA and a western blot was performed first against Myc and then against tubulin. (B) Quantification of A and Figure S6 using Image J. Stn1-Myc intensity normalized for tubulin levels is shown. Values are presented as fold change relative to WT at 30°C. At 30°C, three independent strains were analyzed in two independent experiments (n = 6), while at 37° two independent strains were analyzed once while a third independent strain was analyzed twice (independent experiments, n = 4). The mean is indicated and the error bars indicate the standard deviation. Statistical analyses used the two-tailed t-Test assuming unequal variance (*P < 0.05 and **P < 0.01) performed with SigmaPlot (version 11). (C) WT and mre11Δ cells were transformed with a 2 µm plasmid carrying STN1 or a vector plasmid (plasmids described in Table S4). Six independent (WT and mre11Δ) transformants carrying either the STN1 plasmid or the vector, were cultivated in selective media (-LEU, lacking leucine) until saturation and spot tests were performed as described in Figure 1 (–LEU plates). Pictures were taken after 3 days of incubation. Two representative strains of each genotype carrying either of the plasmids are shown.

