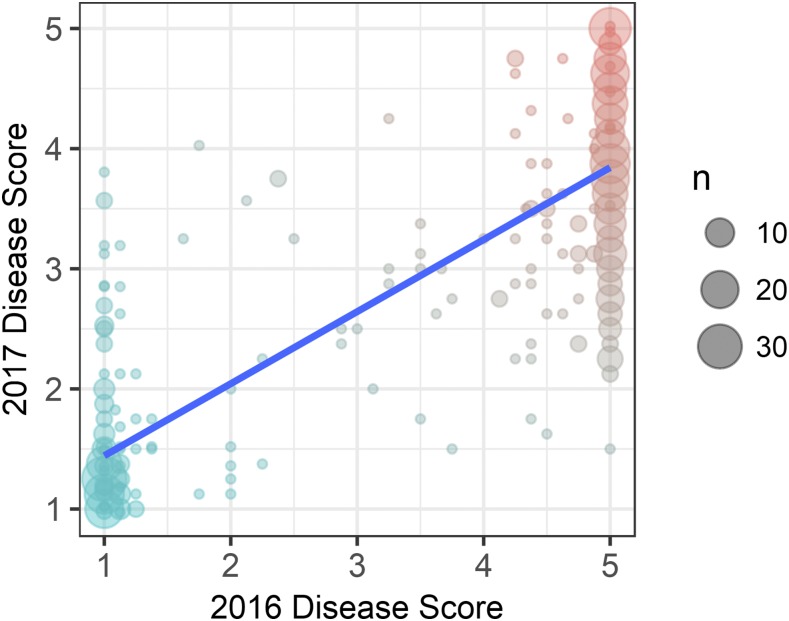
Figure 2.
Phenotypic correlation (Pearson’s r = 0.84, P < 0.001) between years for Fusarium wilt resistance phenotypes in strawberry. A fitted linear regression is shown in blue. Fusarium wilt resistance was phenotyped in 2016 and 2017 field experiments in Davis, California among 565 strawberry germplasm accessions artificially inoculated with isolate AMP132 of Fusarium oxysporum f. sp. fragariae. The phenotypes shown were observed nine weeks post-inoculation in 2016 (x-axis) and 36 weeks post-inoculation in 2017 (y-axis).

